

Question: Hello, Can I get some help on how to create this code? Thank you Convert Berkeley Madonna code to Matlab (submit your m.file). Solutions/ graphs
Hello, Can I get some help on how to create this code? Thank you
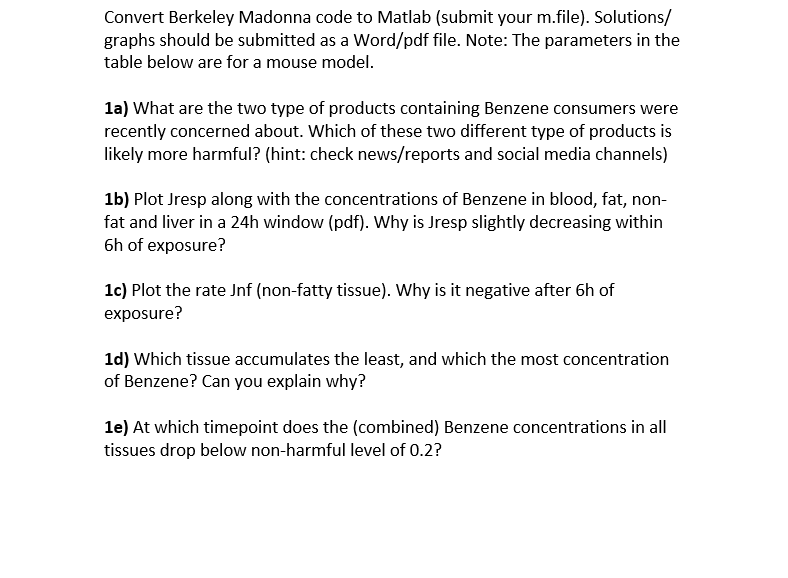
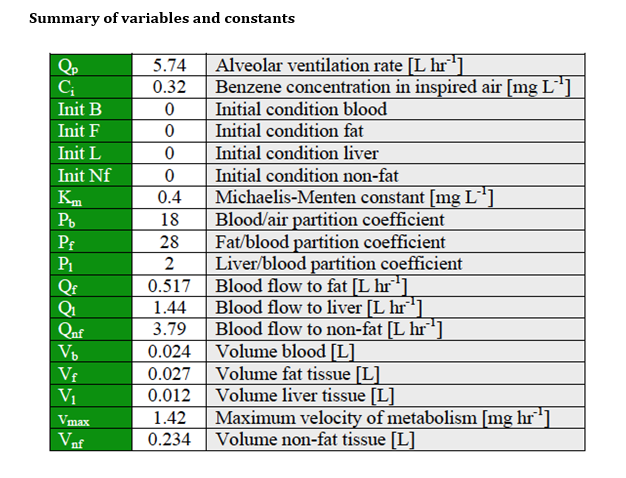
Convert Berkeley Madonna code to Matlab (submit your m.file). Solutions/ graphs should be submitted as a Word/pdf file. Note: The parameters in the table below are for a mouse model.
1a) What are the two type of products containing Benzene consumers were recently concerned about. Which of these two different type of products is likely more harmful? (hint: check news/reports and social media channels)
1b) Plot Jresp along with the concentrations of Benzene in blood, fat, non-fat and liver in a 24h window (pdf). Why is Jresp slightly decreasing within 6h of exposure?
1c) Plot the rate Jnf (non-fatty tissue). Why is it negative after 6h of exposure?
1d) Which tissue accumulates the least, and which the most concentration of Benzene? Can you explain why?
1e) At which timepoint does the (combined) Benzene concentrations in all tissues drop below non-harmful level of 0.2? Here is the Berkeley Madonna code: {Top model}
METHOD RK4
STARTTIME = 0 STOPTIME = 24 DT = 0.02
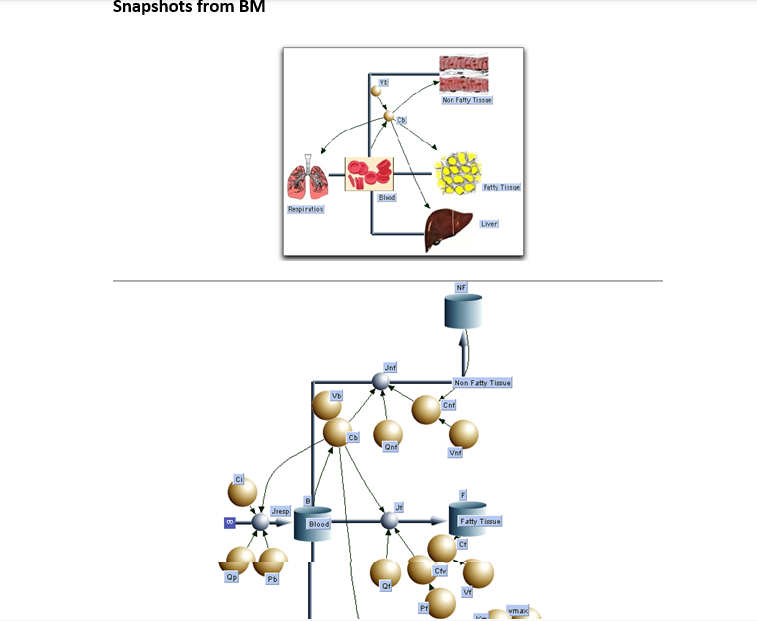
{Reservoirs Blood, Fat, NonFat and Liver} d/dt (NF) = + Jnf INIT NF = 0 d/dt (F) = + Jf INIT F = 0 d/dt (B) = - Jnf - Jf - Jl + Jresp INIT B = 0 d/dt (L) = + Jl - Jmetab INIT L = 0
{Flows} Jnf = Qnf*(Cb-Cnf) Jf = Qf*(Cb-Cfv) Jl = Ql*(Cb - Clv) Jmetab = vmax*Cl/(Km + Cl)
{Replace squarepulse with " IF t>6h Jresp=0 "} Jresp = Qp*(Ci - (Cb/Pb))*squarepulse(0,6)
{Functions} Vnf = 1 Cnf = NF/Vnf Qnf = 1 Vf = 1 Cf = F/Vf Qf = 1 Cb = B/Vb Vb = 1 Cfv = Cf/Pf Pf = 20 Vl = 1 Cl = L/Vl Ql = 1 vmax = 1 Km = 1 Pl = 2 Clv = Cl/Pl Pb = 18 {Benzene conc in inhaled air} Ci = 0.32 {alveolar ventilation rate} Qp = 5.74
Convert Berkeley Madonna code to Matlab (submit your m.file). Solutions/ graphs should be submitted as a Word/pdf file. Note: The parameters in the table below are for a mouse model. 1a) What are the two type of products containing Benzene consumers were recently concerned about. Which of these two different type of products is likely more harmful? (hint: check news/reports and social media channels) 1b) Plot Jresp along with the concentrations of Benzene in blood, fat, nonfat and liver in a 24h window (pdf). Why is Jresp slightly decreasing within 6 h of exposure? 1c) Plot the rate Jnf (non-fatty tissue). Why is it negative after 6 h of exposure? 1d) Which tissue accumulates the least, and which the most concentration of Benzene? Can you explain why? 1e) At which timepoint does the (combined) Benzene concentrations in all tissues drop below non-harmful level of 0.2 ? Summary of variables and constants Snapshots from BM Convert Berkeley Madonna code to Matlab (submit your m.file). Solutions/ graphs should be submitted as a Word/pdf file. Note: The parameters in the table below are for a mouse model. 1a) What are the two type of products containing Benzene consumers were recently concerned about. Which of these two different type of products is likely more harmful? (hint: check news/reports and social media channels) 1b) Plot Jresp along with the concentrations of Benzene in blood, fat, nonfat and liver in a 24h window (pdf). Why is Jresp slightly decreasing within 6 h of exposure? 1c) Plot the rate Jnf (non-fatty tissue). Why is it negative after 6 h of exposure? 1d) Which tissue accumulates the least, and which the most concentration of Benzene? Can you explain why? 1e) At which timepoint does the (combined) Benzene concentrations in all tissues drop below non-harmful level of 0.2 ? Summary of variables and constants Snapshots from BM
Step by Step Solution
There are 3 Steps involved in it

Get step-by-step solutions from verified subject matter experts