

Question: Hello can somebody help me with this problem, I'm really lost. also can anyone explain to me how to draw a cost curve graph that

Hello can somebody help me with this problem, I'm really lost. also can anyone explain to me how to draw a cost curve graph that plots number of attendees versus cost and versus revenue, and how can I identify the break even point. Thanks advance.
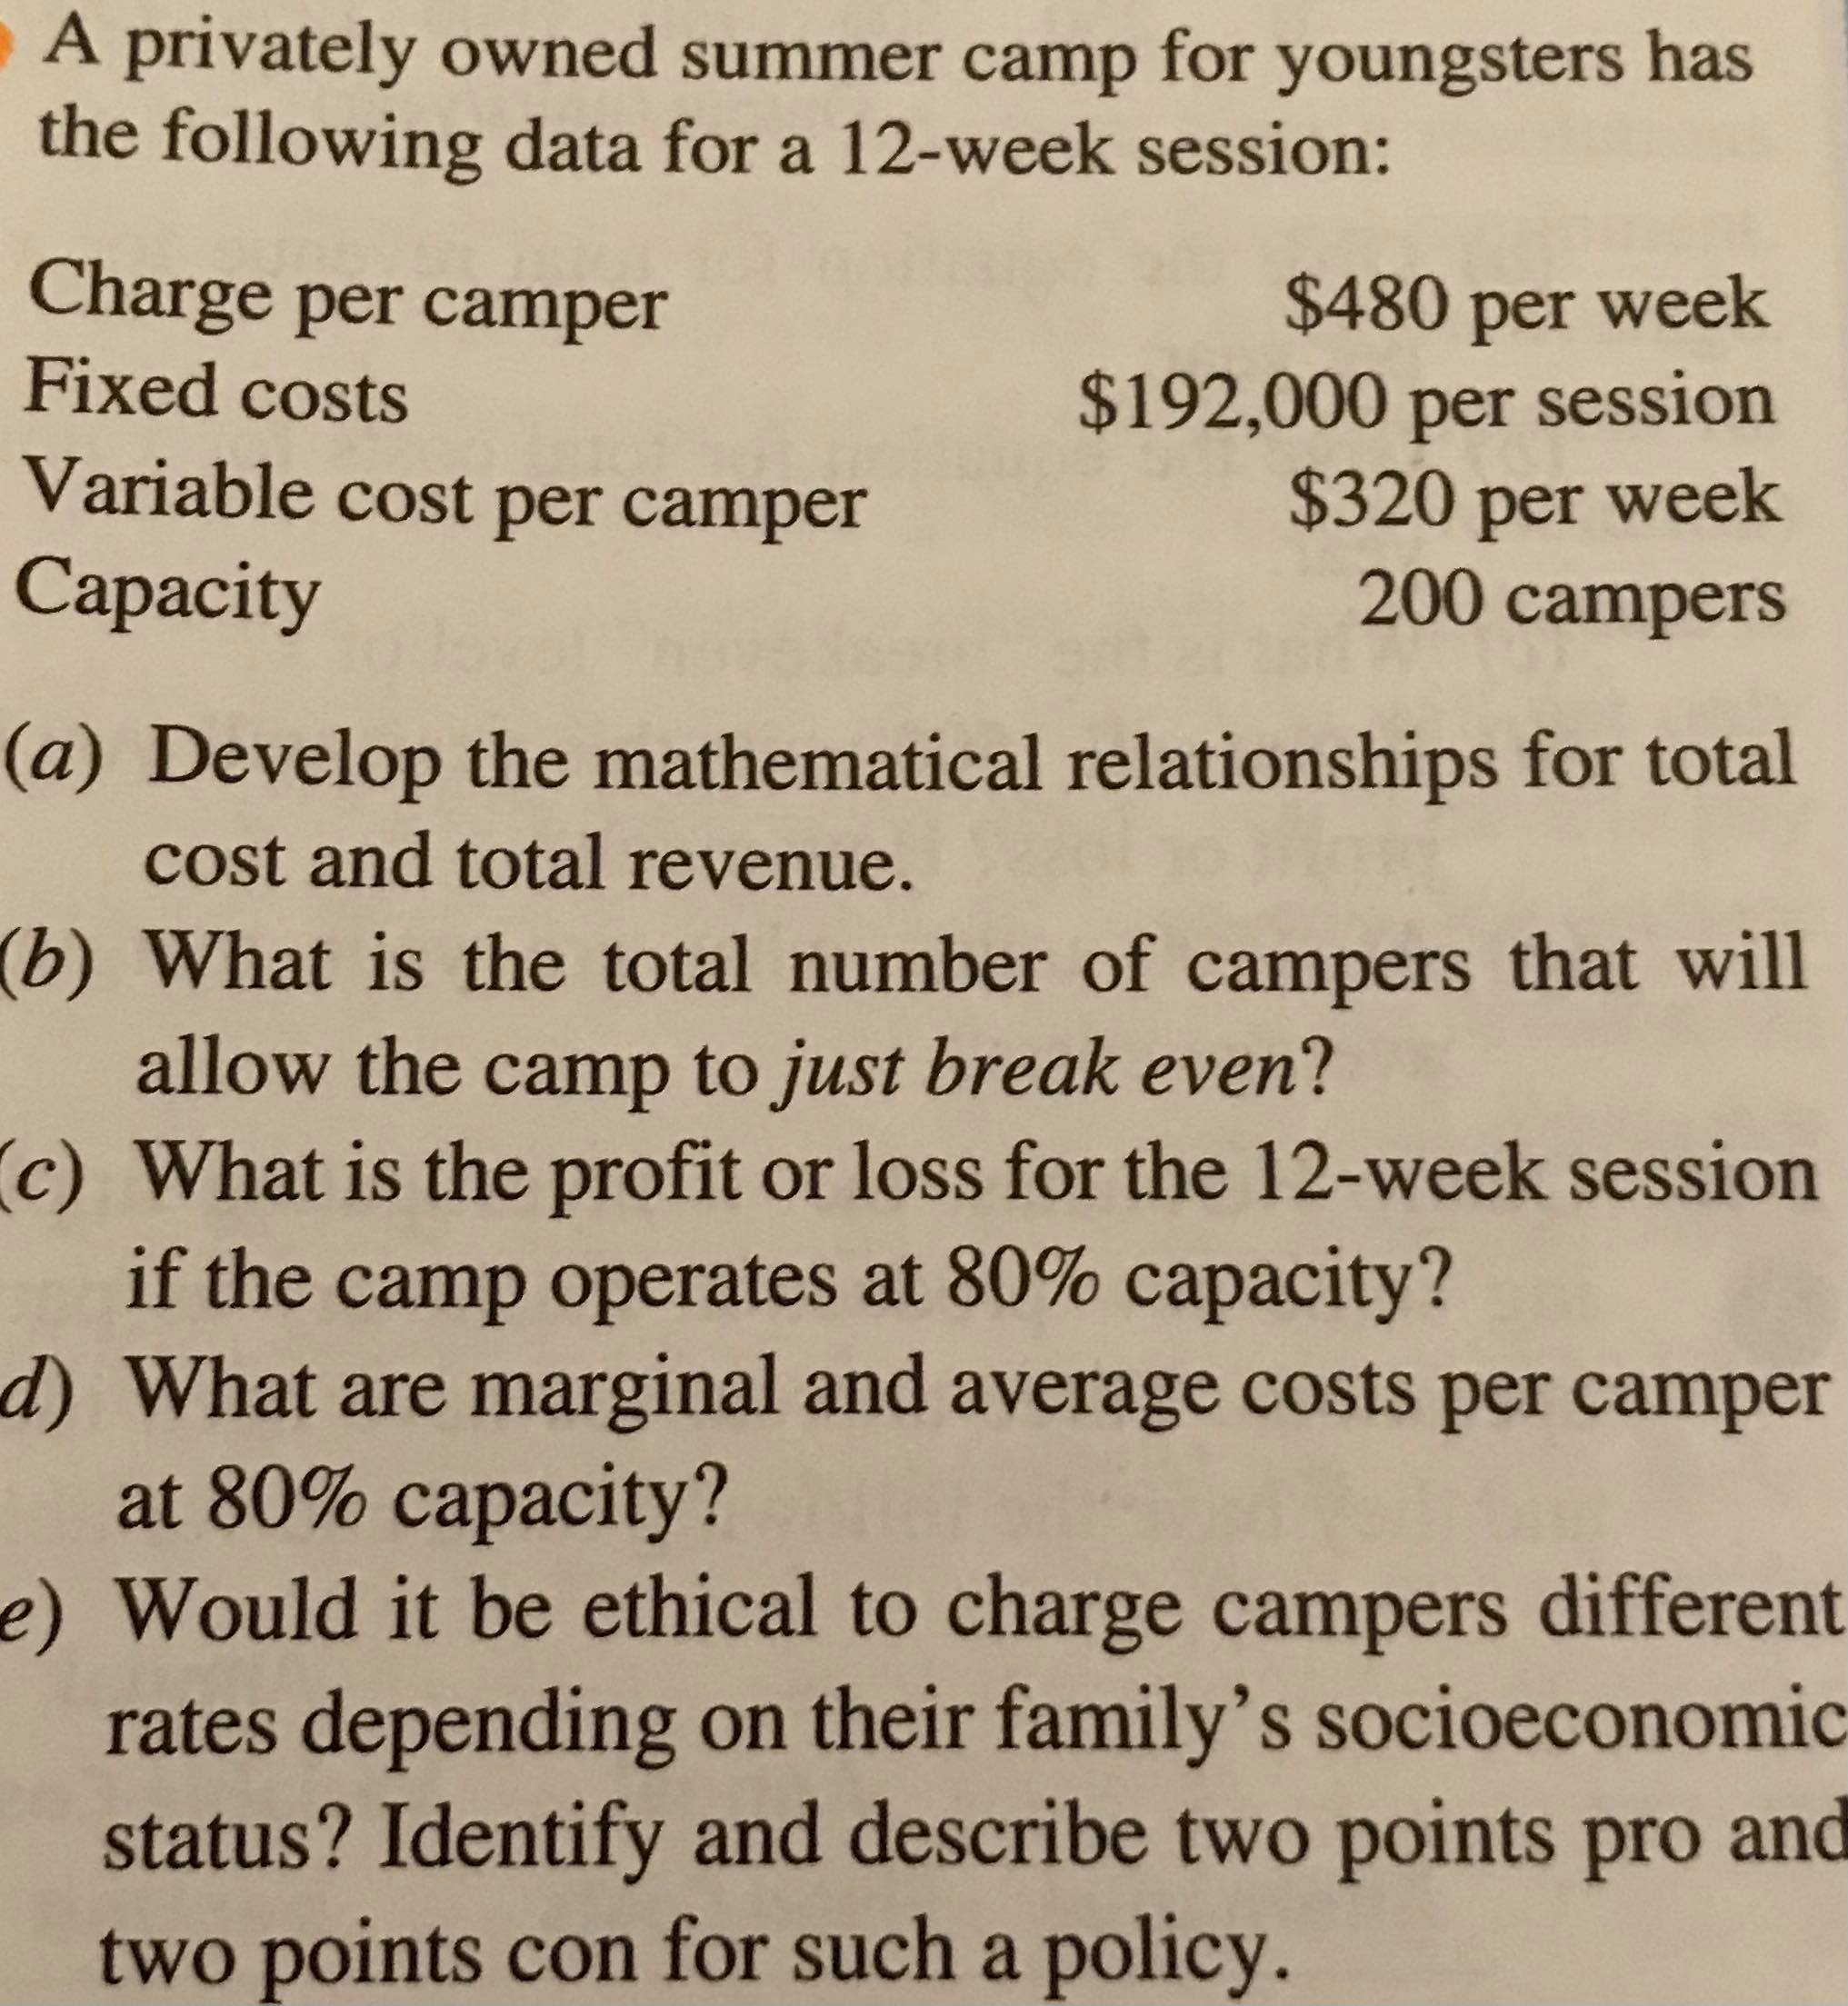
A privately owned summer camp for youngsters has the following data for a 12-week session: Charge per camper $480 per week Fixed costs $192,000 per session Variable cost per camper $320 per week Capacity 200 campers (a) Develop the mathematical relationships for total cost and total revenue. b) What is the total number of campers that will allow the camp to just break even? c) What is the profit or loss for the 12-week session if the camp operates at 80% capacity? d) What are marginal and average costs per camper at 80% capacity? e) Would it be ethical to charge campers different rates depending on their family's socioeconomic status? Identify and describe two points pro and two points con for such a policy
Step by Step Solution
There are 3 Steps involved in it

Get step-by-step solutions from verified subject matter experts