

Question: Hello, can someone please explain to me what i need to do/use to plot the new money demand curve, I am so lost, what do
Hello, can someone please explain to me what i need to do/use to plot the new money demand curve, I am so lost, what do i need to take into consideration based on the graphs in order to plot the new Money Demand Curve. I would appreciate the help, thank you!
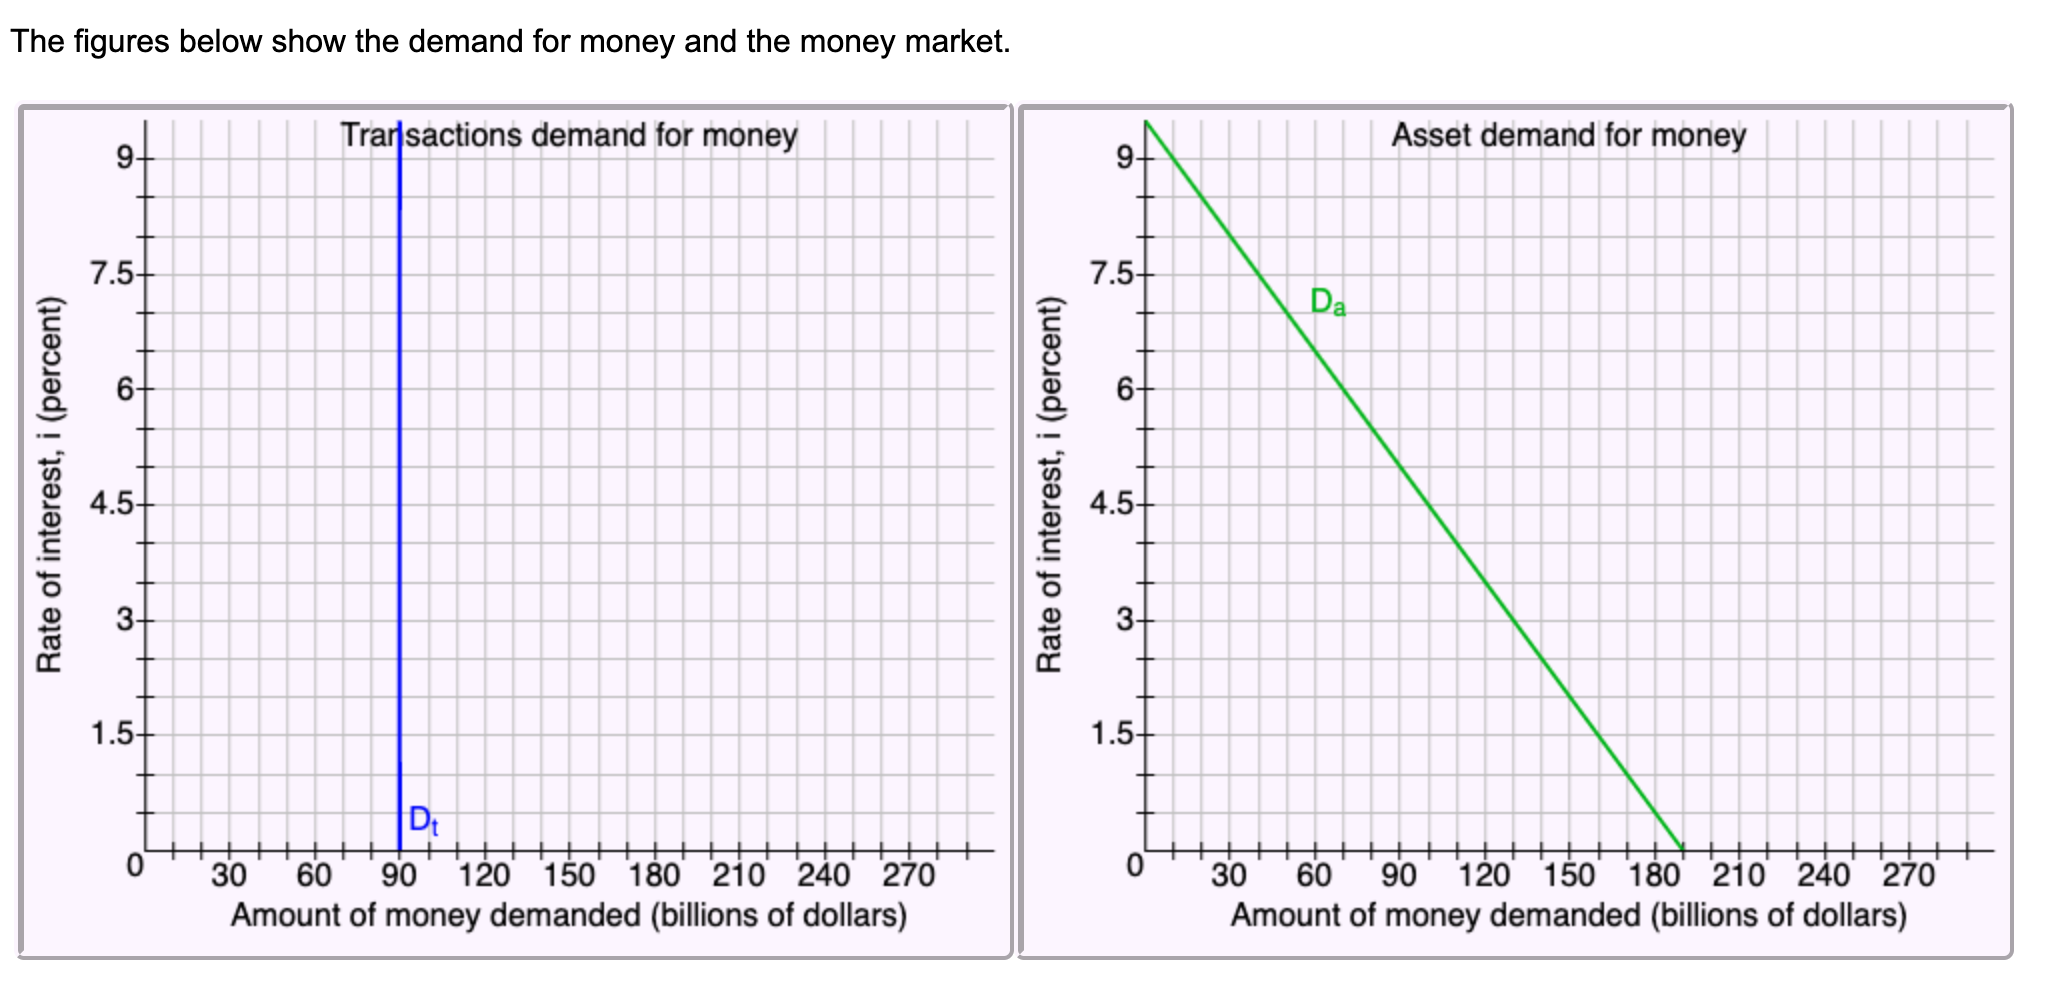
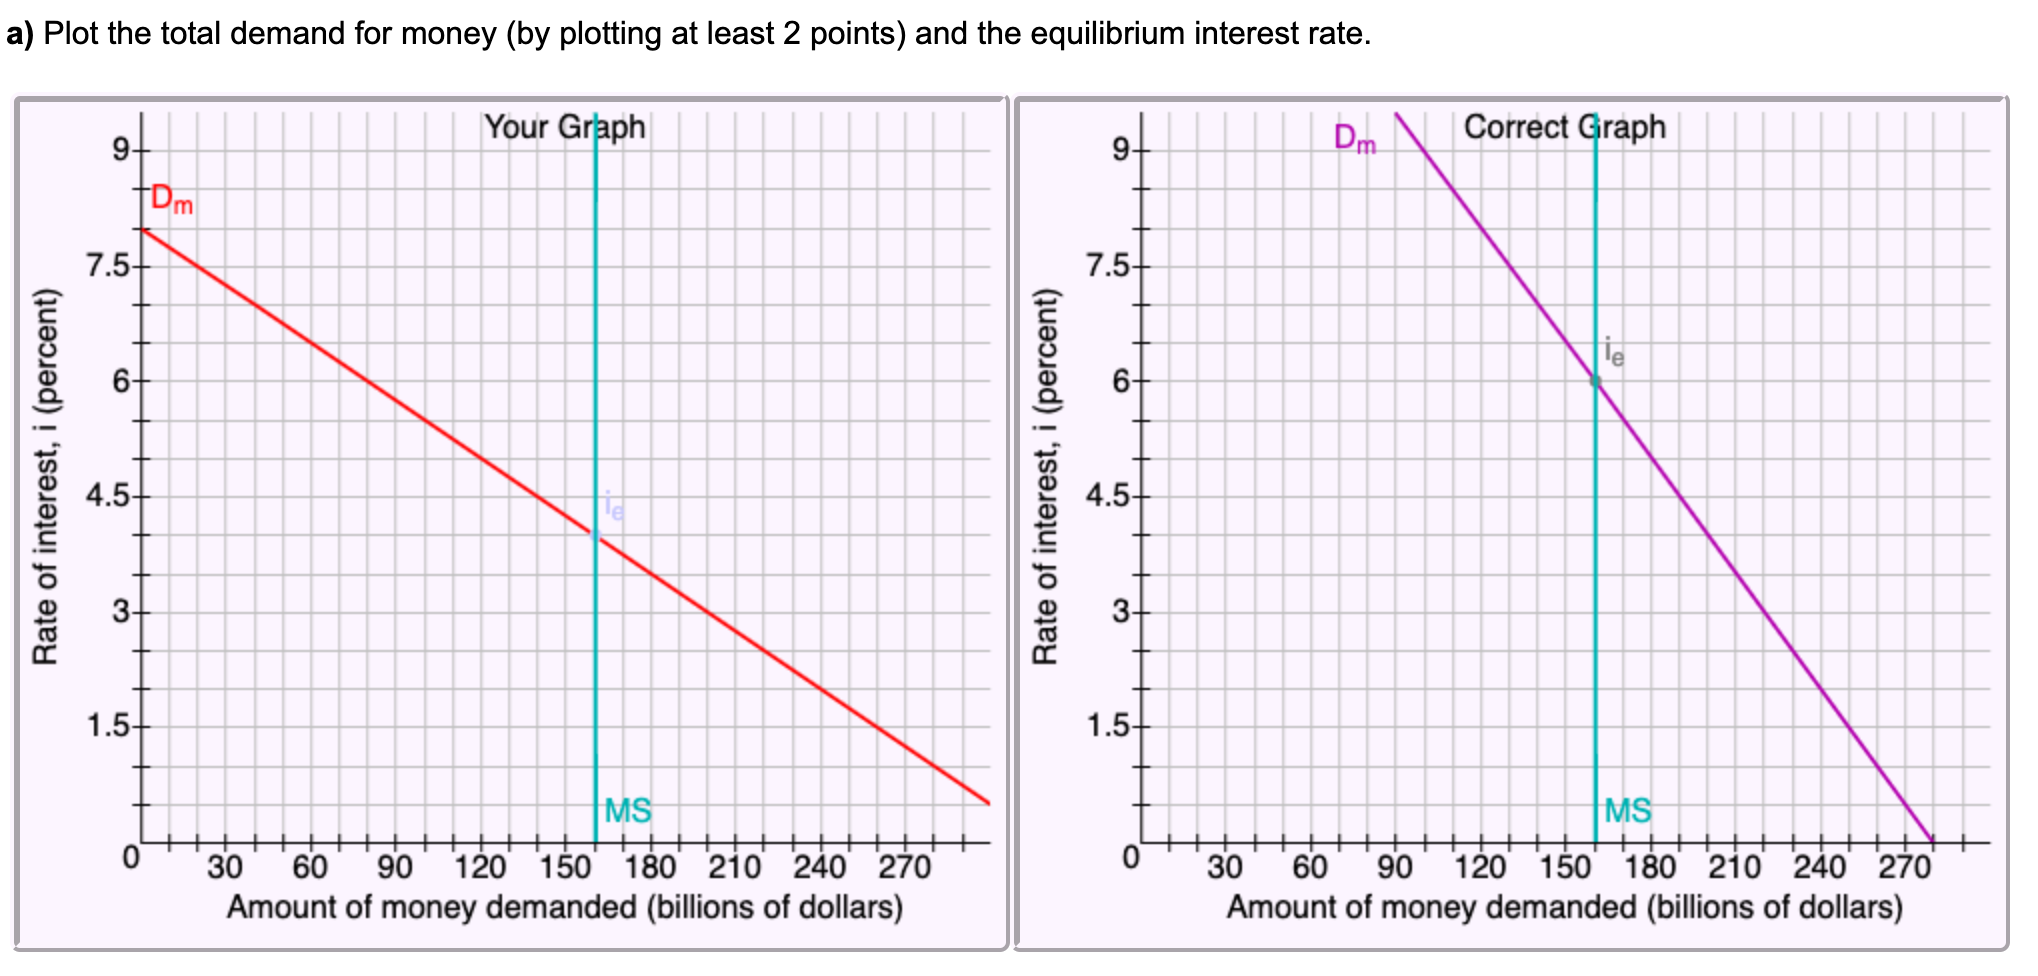
The figures below show the demand for money and the money market. CO Transactions demand for money Asset demand for money 7.5- 7.5- Rate of interest, i (percent) 6- 4.5 w Rate of interest, i (percent) Da 6- 4.5 3- 1.5- 1.5. Di 0 30 60 90 120 150 180 210 240 270 0 30 60 90 120 150 180 210 240 270 Amount of money demanded (billions of dollars) Amount of money demanded (billions of dollars)a) Plot the total demand for money (by plotting at least 2 points) and the equilibrium interest rate. Your Graph Dm Correct Graph 7.5 7.5- Rate of interest, i (percent) 6- 4.5 3- Rate of interest, i (percent) 4.5 1.5- 1.5- MS 0 + + MS 30 60 90 120 150 180 210 240 270 O' + + 30 60 90 120 150 180 210 240 270 Amount of money demanded (billions of dollars) Amount of money demanded (billions of dollars)
Step by Step Solution
There are 3 Steps involved in it

Get step-by-step solutions from verified subject matter experts