Question: Hello, can you please help me solve this problems. this problem from my Corporate and Business Strategy Management class I did not see oprion to
Hello, can you please help me solve this problems. this problem from my "Corporate and Business Strategy Management" class I did not see oprion to select this class so just select finance.
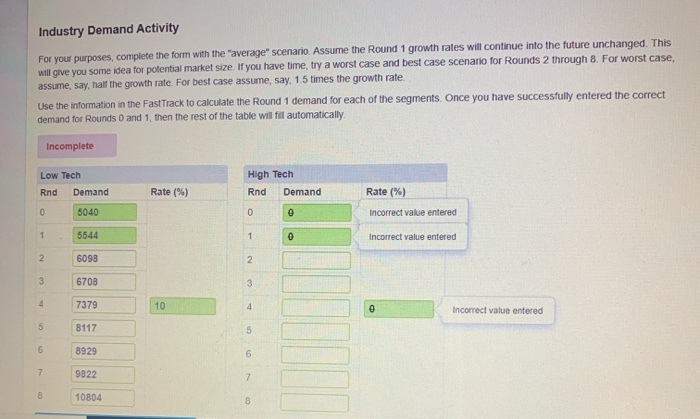
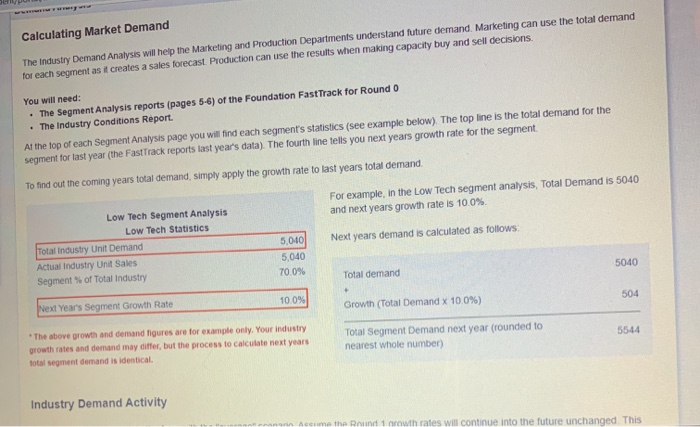
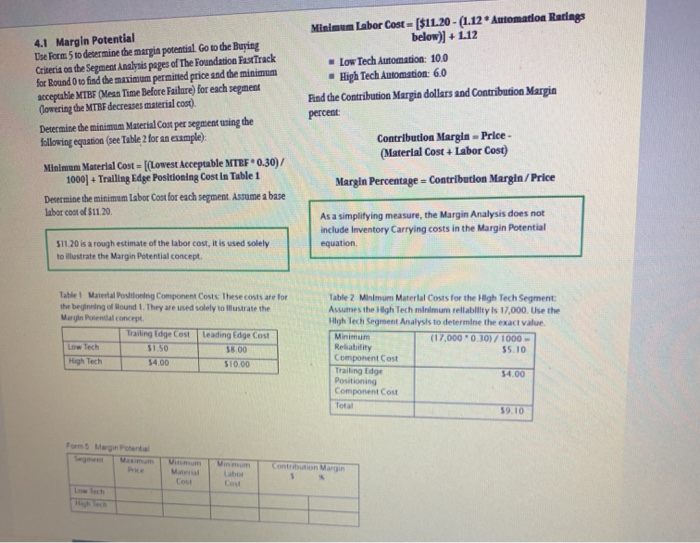
Industry Demand Activity For your purposes, complete the form with the "average" scenario. Assume the Round 1 growth rates will continue into the future unchanged. This will give you some idea for potential market size. If you have time, try a worst case and best case scenario for Rounds 2 through 8. For worst case, assume, say, half the growth rate. For best case assume, say, 1.5 times the growth rate. Use the information in the FastTrack to calculate the Round 1 demand for each of the segments. Once you have successfully entered the correct demand for Rounds 0 and 1, then the rest of the table will fill automatically Incomplete Low Tech High Tech Rnd Demand Rnd Demand Rate (%) Rate(%) 0 5040 0 0 Incorrect value entered 1 5544 1 0 Incorrect value entered 2 6098 2 3 6708 3 4 7379 10 4 0 Incorrect value entered 5 8117 5 6 8929 6 7 9822 7 10804 8 Calculating Market Demand The Industry Demand Analysis will help the Marketing and Production Departments understand future demand. Marketing can use the total demand for each segment as it creates a sales forecast Production can use the results when making capacity buy and sell decisions. You will need: The Segment Analysis reports (pages 5-6) of the Foundation FastTrack for Round o The Industry Conditions Report. Al the top of each Segment Analysis page you will find each segment's statistics (see example below). The top line is the total demand for the segment for last year (the FastTrack reports last year's data). The fourth line tells you next years growth rate for the segment To find out the coming years total demand, simply apply the growth rate to last years total demand. For example, in the Low Tech segment analysis, Total Demand is 5040 and next years growth rate is 100% Next years demand is calculated as follows: Low Tech Segment Analysis Low Tech Statistics Total Industry Unit Demand Actual Industry Unit Sales Segment of Total Industry 5,040 5,040 70.0% 5040 Total demand 504 100% Next Year's Segment Growth Rate Growth (Total Demand x 10.0%) 5544 The above growth and demand figures are for example only. Your industry growth rates and demand may differ, but the process to calculate next years total segment demand is identical. Total Segment Demand next year (rounded to nearest whole number) Industry Demand Activity Acume the Round 1 rowth rates will continue into the future unchanged. This 4.1 Margin Potential Die Form 5 to determine the margin potential Go to the Buying Criteria on the Segment Analysis pages of the Foundation FastTrack for Round 0 to find the maximum permitted price and the minimum acceptable MTB (Mean Time Before Failure) for each segment (lowering the MTBF decreases material cost). Determine the minimum Material Cost per segment using the following equation (see Table 2 for an example) Minimum Labor Cost = [$1L20 - (1.12 Automation Ratings below)] + L.12 Low Tech Automation: 10.0 High Tech Automation: 6.0 Find the Contribution Margin dollars and Contribution Margin percent Minimum Material Cost = [(Lowest Acceptable MTEF*0.30)/ 1000) + Trailing Edge Positioning Costin Table 1 Determine the minimum labor Cost for each segment. Assume a base labor cost of $11.20 Contribution Margin - Price- (Material Cost + Labor Cost) Margin Percentage = Contribution Margin/Price As a simplifying measure, the Margin Analysis does not include Inventory Carrying costs in the Margin Potential equation $11.20 is a rough estimate of the labor cost, it is used solely to illustrate the Margin Potential concept. Table 1 Material Positioning Component Costs. These costs are for the beginning of Round 1. They are used solely to Illustrate the Margin Potential concept Trailing Edge Cost Leading Edge Cost Low Tech 51 50 58.00 High Tech 54.00 $10.00 Table 2 Minimum Material Costs for the High Tech Segment Assumes the high Tech minimum reliability is 17,000. Use the High Tech Segment Analysis to determine the exact value Minimum (17.000 0.30)/1000 Reliability 55.10 Component Cost Trailing Edge 54.00 Positioning Component Cout Total 59.10 For Morgente Mate Cost Cou