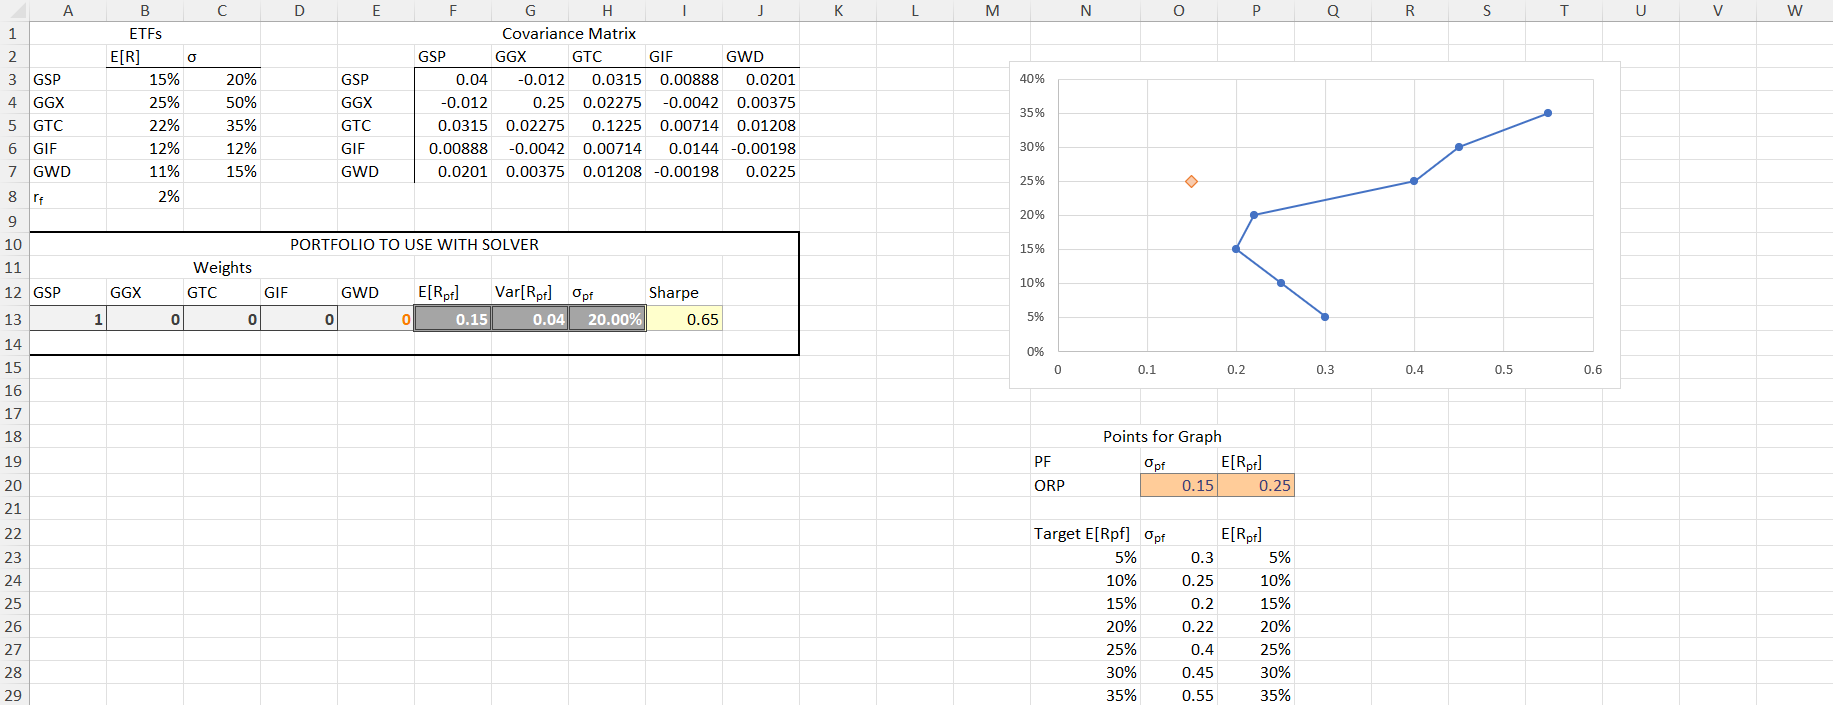
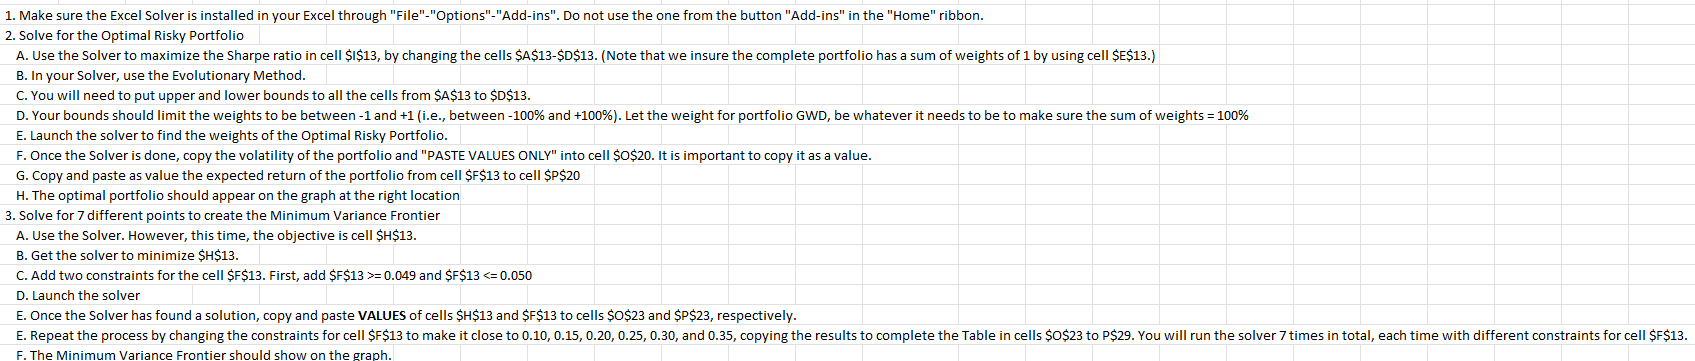
Question: Hello, for this Optimal Risk Portfolio - I need help to complete the following tasks in 3 tasks and sub-tasks. Thank you A B C

Hello, for this Optimal Risk Portfolio - I need help to complete the following tasks in 3 tasks and sub-tasks. Thank you

Hello, for this Optimal Risk Portfolio - I needHello, for this Optimal Risk Portfolio - I need
A B C D E F G H K L M N O P Q R S T U V W ETFS Covariance Matrix E[R] GSP GGX GTC GIF GWD 3 GSF 15% 20% GSP 0.04 0.012 0.0315 0.00888 0.0201 40% 4 GGX 25% 50% GGX -0.012 0.25 0.02275 -0.0042 0.00375 35% 5 GTC 22% 35% GTC 0.0315 0.02275 0.1225 0.00714 0.01208 6 GIF 12% 12% GIF 0.00888 -0.0042 0.00714 0.0144 -0.00198 30% GWD 11% 15% GWD 0.0201 0.00375 0.01208 -0.00198 0.0225 25% 8 re 2% 9 20% 10 PORTFOLIO TO USE WITH SOLVER 15% 11 Weights 10% 12 GSP GGX GTC GIF GWD E[RDF] Var[Rpf] Opf Sharpe 13 1 0 0 0 0 0.15 0.04 20.00% 0.65 5% 14 09% 15 0.1 0.2 0.3 0.4 0.5 0.6 16 17 18 Points for Graph 19 PF Opf E[Rpf ] 20 ORP 0.15 0.25 21 22 Target E[Rpf] Opf E[R pf] 23 5% 0.3 5% 24 10% 0.25 10% 25 15% 0.2 15% 26 20% 0.22 20% 27 25% 0.4 25% 28 30% 0.45 30% 35% 0.55 35%1. Make sure the Excel Solver is installed in your Excel through "File"-"Options"-"Add-ins". Do not use the one from the button "Add-ins" in the "Home" ribbon. 2. solve for the Optimal Risky Portfolia A. Use the Solver to maximize the Sharpe ratio in cell $I$13, by changing the cells $4$13-$D$13. (Note that we insure the complete portfalio has a sum of weights of 1 by using cell $$13.) B. In your Solver, use the Evolutionary Method. C. You will need to put upper and lower bounds to all the cells from $AS13 to SDS13. D. Your bounds should limit the weights to be between -1 and +1 (i.e., between -100% and +100%). Let the weight for portfolio GWD, be whatever it needs to be to make sure the sum of weights = 100% E. Launch the solver to find the weights of the Optimal Risky Portfolio. F.Once the Solver is done, copy the volatility of the portfolio and "PASTE VALUES ONLY" into cell $0$20. It is important to copy it as a value. G. Copy and paste as value the expected return of the portfolio from cell $F$13 to cell $P$20 H. The aptimal portfalio should appear an the graph at the right location 3. Solve for 7 different points to create the Minimum Variance Frontier A. Use the Solver. However, this time, the objective is cell SH513. B. Get the solver ta minimize $H$13. C. Add two constraints for the cell SFS13. First, add $F$13 =0.049 and $F$13

Step by Step Solution

There are 3 Steps involved in it

1 Expert Approved Answer
Step: 1 Unlock blur-text-image
Question Has Been Solved by an Expert!

Get step-by-step solutions from verified subject matter experts

Step: 2 Unlock
Step: 3 Unlock

Students Have Also Explored These Related Finance Questions!