

Question: Hello I am having difficulty understandging how to properly program this using python and i was wondering if someone might be able to help me
Hello I am having difficulty understandging how to properly program this using python and i was wondering if someone might be able to help me how it is this example is supposed o created. I am attaching the guidlines and the three input file in which i am ready from. Thank you sooo much
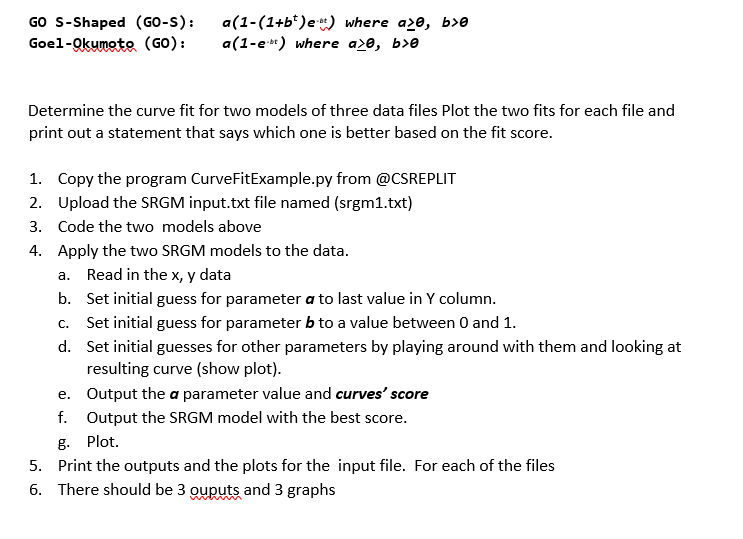
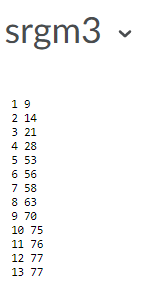
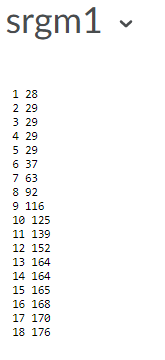
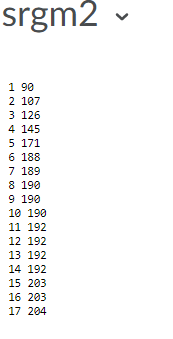
GO S-Shaped (GO-S): Goel-Okumoto (GO): a(1-(1+b+)e ) where are, b>0 a(1-es) where are, b> Determine the curve fit for two models of three data files Plot the two fits for each file and print out a statement that says which one is better based on the fit score. 1. Copy the program CurveFitExample.py from @CSREPLIT 2. Upload the SRGM input.txt file named (srgm1.txt) 3. Code the two models above 4. Apply the two SRGM models to the data. a. Read in the x, y data b. Set initial guess for parameter a to last value in Y column. C. Set initial guess for parameter b to a value between 0 and 1. d. Set initial guesses for other parameters by playing around with them and looking at resulting curve (show plot). e. Output the a parameter value and curves' score f. Output the SRGM model with the best score. 8. Plot. 5. Print the outputs and the plots for the input file. For each of the files 6. There should be 3 ouputs and 3 graphs srgm3 19 2 14 3 21 4 28 5 53 6 56 7 58 8 63 9 70 10 75 11 76 12 77 13 77 srgm1 1 28 2 29 3 29 4 29 5 29 6 37 7 63 8 92 9 116 10 125 11 139 12 152 13 164 14 164 15 165 16 168 17 170 18 176 srgm2 v 1 90 2 107 3 126 4 145 5 171 6 188 7 189 8 199 9 190 10 190 11 192 12 192 13 192 14 192 15 203 16 203 17 204 GO S-Shaped (GO-S): Goel-Okumoto (GO): a(1-(1+b+)e ) where are, b>0 a(1-es) where are, b> Determine the curve fit for two models of three data files Plot the two fits for each file and print out a statement that says which one is better based on the fit score. 1. Copy the program CurveFitExample.py from @CSREPLIT 2. Upload the SRGM input.txt file named (srgm1.txt) 3. Code the two models above 4. Apply the two SRGM models to the data. a. Read in the x, y data b. Set initial guess for parameter a to last value in Y column. C. Set initial guess for parameter b to a value between 0 and 1. d. Set initial guesses for other parameters by playing around with them and looking at resulting curve (show plot). e. Output the a parameter value and curves' score f. Output the SRGM model with the best score. 8. Plot. 5. Print the outputs and the plots for the input file. For each of the files 6. There should be 3 ouputs and 3 graphs srgm3 19 2 14 3 21 4 28 5 53 6 56 7 58 8 63 9 70 10 75 11 76 12 77 13 77 srgm1 1 28 2 29 3 29 4 29 5 29 6 37 7 63 8 92 9 116 10 125 11 139 12 152 13 164 14 164 15 165 16 168 17 170 18 176 srgm2 v 1 90 2 107 3 126 4 145 5 171 6 188 7 189 8 199 9 190 10 190 11 192 12 192 13 192 14 192 15 203 16 203 17 204
Step by Step Solution
There are 3 Steps involved in it

Get step-by-step solutions from verified subject matter experts