

Question: Hello, I am trying to understand and learn this graph and the question which follow. The U.S. economy is in both short-run and long-run equilibrium,

Hello,
I am trying to understand and learn this graph and the question which follow.

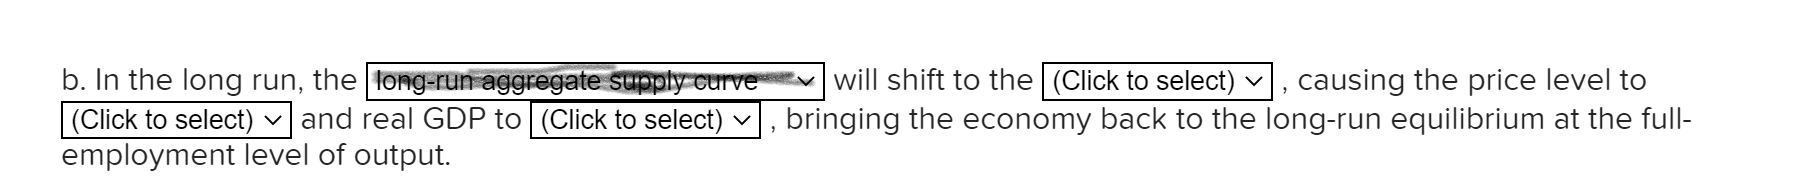
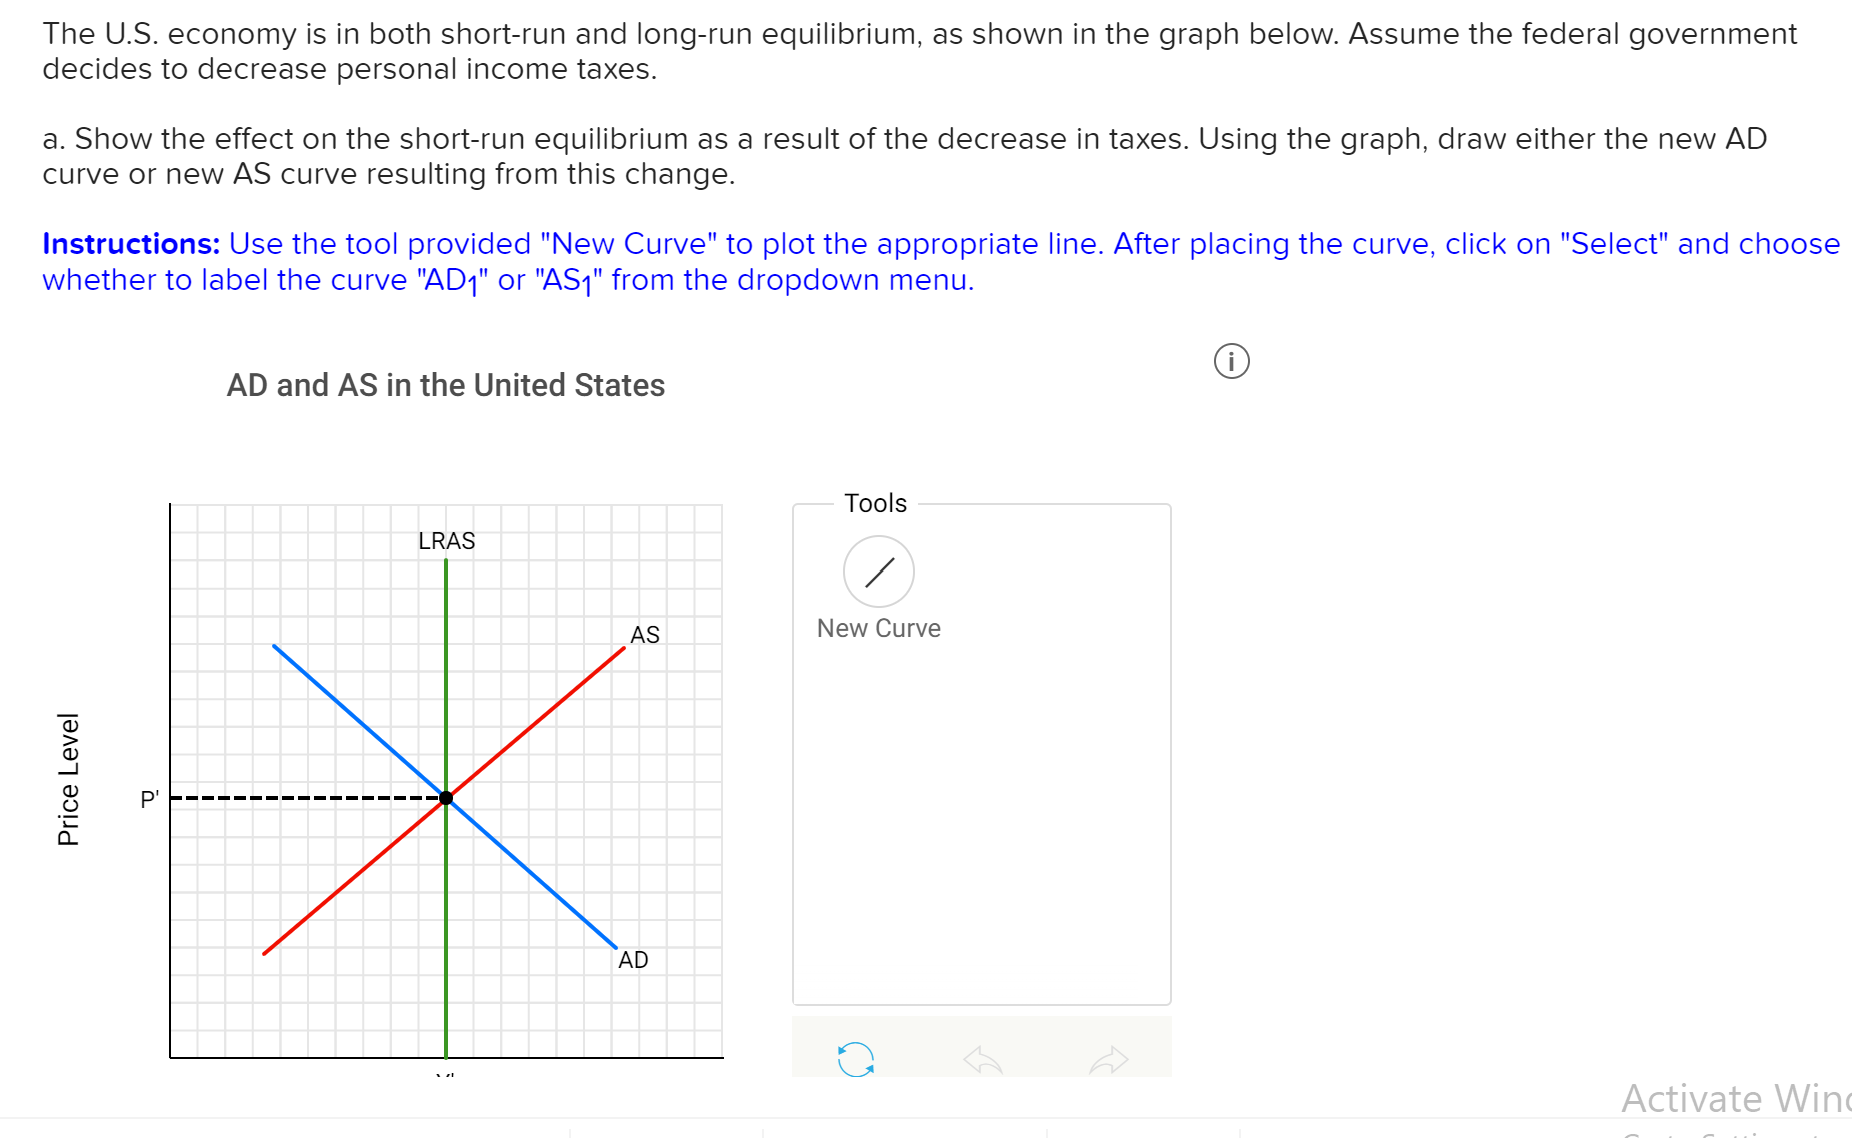
The U.S. economy is in both short-run and long-run equilibrium, as shown in the graph below. Assume the federal government decides to decrease personal income taxes. a. Show the effect on the shortrun equilibrium as a result of the decrease in taxes. Using the graph, draw either the new AD curve or new AS curve resulting from this change. Instructions: Use the tool provided "New Curve" to plot the appropriate line. After placing the curve, click on "Select" and choose whether to label the curve "AD1" or "A81" from the dropdown menu. AD and AS in the United States Tools / New Curve Price Level O Activate Winc b. In the long run, the M will shift to the (Click to select) v , causing the price level to (Click to select) v and real GDP to (Click to select) v , bringing the economy back to the long-run equilibrium at the full- employment level of output
Step by Step Solution
There are 3 Steps involved in it

Get step-by-step solutions from verified subject matter experts