

Question: Hello, I have a question about a operator balance chart. I have an operator balance chartin front of me and the manager criticizes current poor
Hello, I have a question about a operator balance chart. I have an operator balance chartin front of me and the manager criticizes current poor delivery reliability of the company. But when I look at the operator balance chart diagram, all processes are below to the customer tact time. The customer tact time is this horizontal dashed line.
Can it be that the delivery reliability can also be bad if some of the processes are close to the customer cycle, like in the diagram? Because if one process is above the takt time it represent a bottlenleck. Why in this case the customer is complaining a bad delivery reliability?
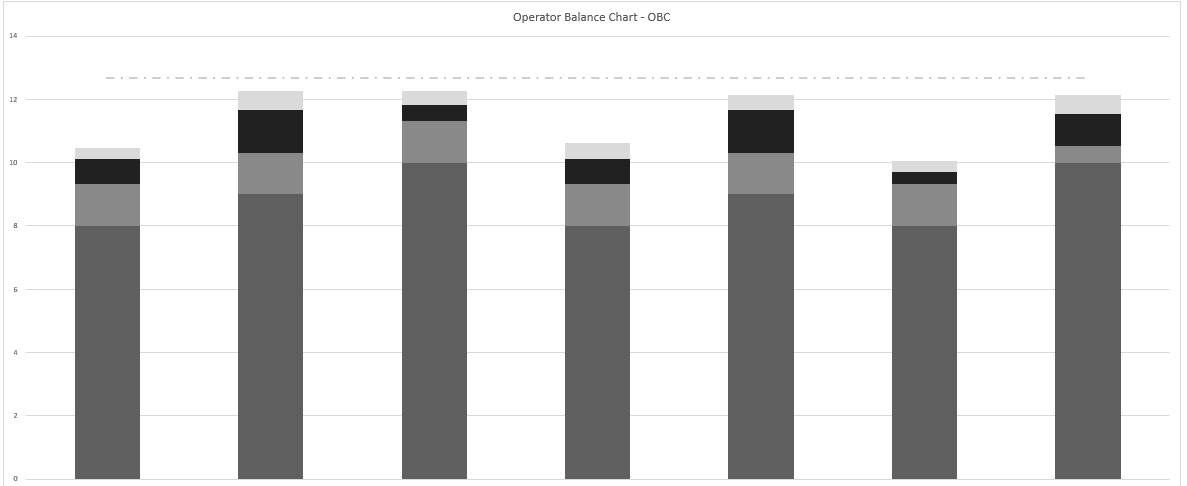
Operator Balance Chart - OBC 14 12 10
Step by Step Solution
There are 3 Steps involved in it
1 Expert Approved Answer
Step: 1 Unlock

Question Has Been Solved by an Expert!
Get step-by-step solutions from verified subject matter experts
Step: 2 Unlock
Step: 3 Unlock