

Question: Hello, I have R programming questions. I need your help. Thank you so much. Instructions: The following question deals with the data set N H
Hello, I have R programming questions.
I need your help.
Thank you so much.
Instructions:
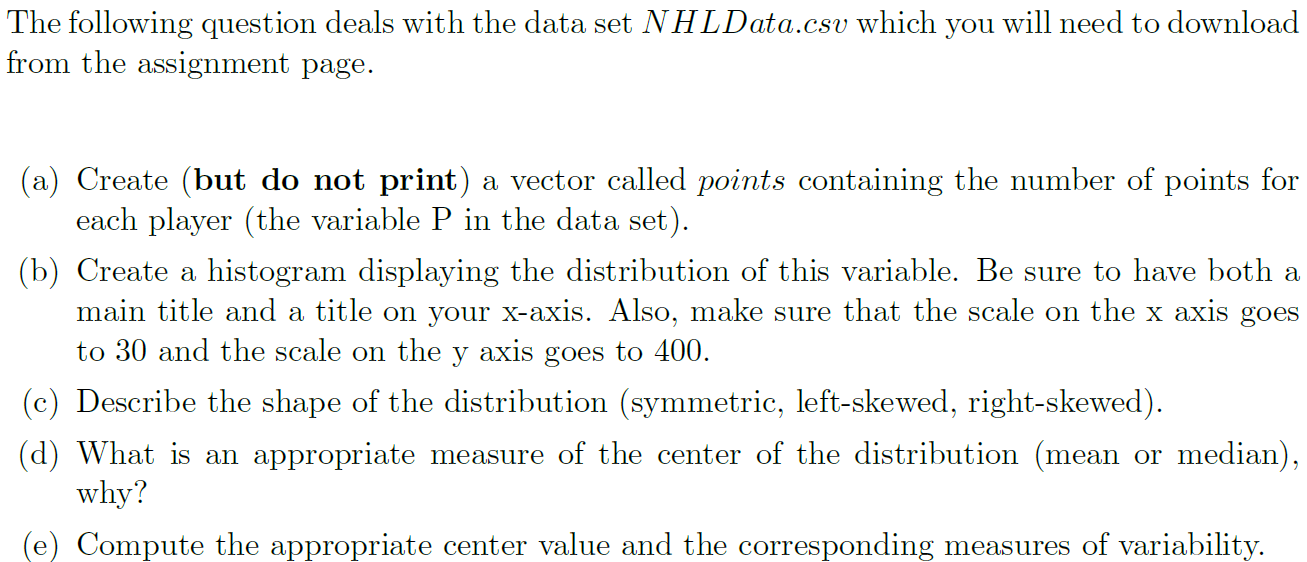

The following question deals with the data set N H LData.csv Which you will need to download from the assignment page. (a) Create (but do not print) a vector called points containing the number of points for each player (the variable P in the data set). (b) Create a histogram displaying the distribution of this variable. Be sure to have both a main title and a title on your Xaxis. Also, make sure that the scale on the X axis goes to 30 and the scale on the y axis goes to 400. (c) Describe the shape of the distribution (symmetric, leftskewed, rightskewed). (d) What is an appropriate measure of the center of the distribution (mean or median), Why? (e) Compute the appropriate center value and the corresponding measures of variability. Using R Markdown, please complete the following assignment. If an answer does not require any R code, you can type the answer to the question outside of a chunk. Make sure that your assignment is well labelled so that it is clear where each question:s answer begins. Your assignment
Step by Step Solution
There are 3 Steps involved in it

Get step-by-step solutions from verified subject matter experts