

Question: Hello, I need help figuring out how you get to the solution. Please include each step so i understand. Best, Problem 1a - b The
Hello, 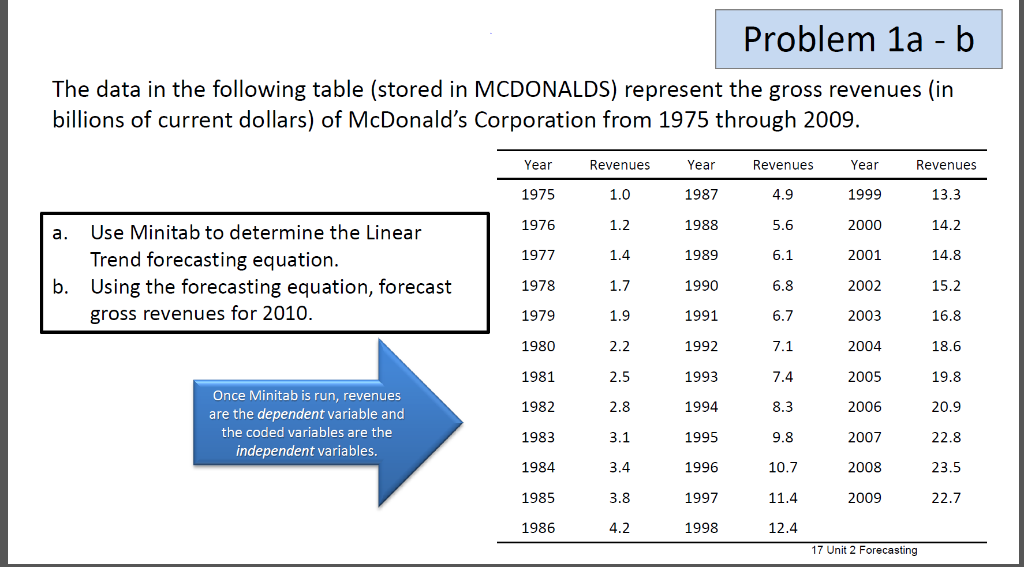
I need help figuring out how you get to the solution. Please include each step so i understand.
Best,
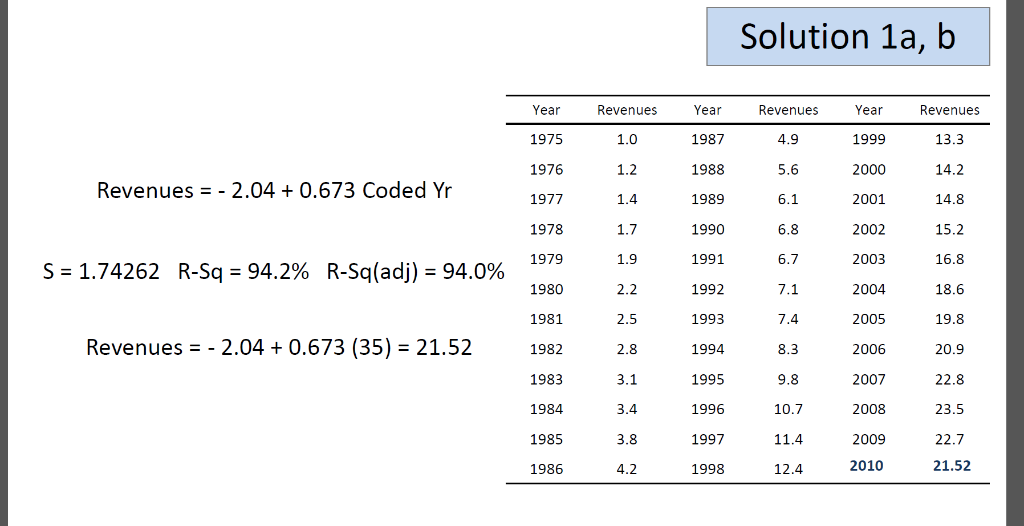
Problem 1a - b The data in the following table (stored in MCDONALDS) represent the gross revenues (in billions of current dollars) of McDonald's Corporation from 1975 through 2009. Year 1975 1976 1977 1978 1979 1980 1981 1982 1983 1984 1985 1986 Revenues 1.0 1.2 Year 1987 1988 1989 1990 1991 1992 1993 1994 1995 1996 1997 1998 Revenues 4.9 5.6 6.1 6.8 6.7 Year 1999 2000 2001 2002 2003 2004 2005 2006 2007 2008 2009 Revenues 13.3 14.2 14.8 15.2 16.8 18.6 19.8 20.9 22.8 23.5 22.7 Use Minitab to determine the Linear Trend forecasting equation Using the forecasting equation, forecast gross revenues for 2010. a. 1.7 1.9 2.2 2.5 2.8 3.1 3.4 3.8 4.2 b. 7.4 8.3 9.8 10.7 11.4 12.4 Once Minitab is run, revenues are the dependent variable and the coded variables are the independent variables. 17 Unit 2 Forecasting Solution 1a, b Year 1975 1976 1977 1978 1979 Revenues 1.0 1.2 1.4 1.7 Year 1987 1988 1989 1990 1991 Revenues 4.9 5.6 6.1 6.8 6.7 7.1 7.4 8.3 9.8 10.7 11.4 12.4 Year 1999 2000 2001 2002 2003 2004 2005 2006 2007 2008 2009 2010 Revenues 13.3 14.2 14.8 15.2 16.8 18.6 19.8 20.9 22.8 23.5 22.7 21.52 Revenues- 2.040.673 Coded Yr s-1.74262 R-Sq-94.2% R-Sq(adj) 94.0% 1980 2.2 1992 2.5 2.8 3.1 3.4 3.8 4.2 1993 1994 1995 1996 1997 1998 1981 Revenues _ _ 2.04 + 0.673 (35) = 21.52 1982 1983 1984 1985 1986 Problem 1a - b The data in the following table (stored in MCDONALDS) represent the gross revenues (in billions of current dollars) of McDonald's Corporation from 1975 through 2009. Year 1975 1976 1977 1978 1979 1980 1981 1982 1983 1984 1985 1986 Revenues 1.0 1.2 Year 1987 1988 1989 1990 1991 1992 1993 1994 1995 1996 1997 1998 Revenues 4.9 5.6 6.1 6.8 6.7 Year 1999 2000 2001 2002 2003 2004 2005 2006 2007 2008 2009 Revenues 13.3 14.2 14.8 15.2 16.8 18.6 19.8 20.9 22.8 23.5 22.7 Use Minitab to determine the Linear Trend forecasting equation Using the forecasting equation, forecast gross revenues for 2010. a. 1.7 1.9 2.2 2.5 2.8 3.1 3.4 3.8 4.2 b. 7.4 8.3 9.8 10.7 11.4 12.4 Once Minitab is run, revenues are the dependent variable and the coded variables are the independent variables. 17 Unit 2 Forecasting Solution 1a, b Year 1975 1976 1977 1978 1979 Revenues 1.0 1.2 1.4 1.7 Year 1987 1988 1989 1990 1991 Revenues 4.9 5.6 6.1 6.8 6.7 7.1 7.4 8.3 9.8 10.7 11.4 12.4 Year 1999 2000 2001 2002 2003 2004 2005 2006 2007 2008 2009 2010 Revenues 13.3 14.2 14.8 15.2 16.8 18.6 19.8 20.9 22.8 23.5 22.7 21.52 Revenues- 2.040.673 Coded Yr s-1.74262 R-Sq-94.2% R-Sq(adj) 94.0% 1980 2.2 1992 2.5 2.8 3.1 3.4 3.8 4.2 1993 1994 1995 1996 1997 1998 1981 Revenues _ _ 2.04 + 0.673 (35) = 21.52 1982 1983 1984 1985 1986
Step by Step Solution
There are 3 Steps involved in it

Get step-by-step solutions from verified subject matter experts