

Question: The data in the table below shows the usage of a basket of three food items in a household for April 2020 and May
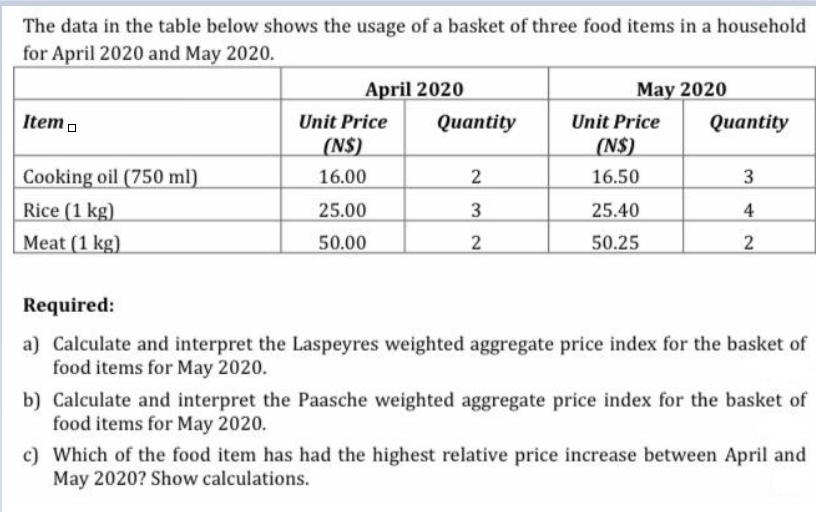
The data in the table below shows the usage of a basket of three food items in a household for April 2020 and May 2020. April 2020 May 2020 Item o Unit Price Qantity Unit Price Qntity (NS) (N$) Cooking oil (750 ml) 16.00 16.50 3 Rice (1 kg) 25.00 3 25.40 4 Meat (1 kg) 50.00 50.25 Required: a) Calculate and interpret the Laspeyres weighted aggregate price index for the basket of food items for May 2020. b) Calculate and interpret the Paasche weighted aggregate price index for the basket of food items for May 2020. c) Which of the food item has had the highest relative price increase between April and May 2020? Show calculations.
Step by Step Solution
3.50 Rating (167 Votes )
There are 3 Steps involved in it
Laspseyred index Elobseovation price x Base gty l base poice x Bode gty Obser vation ... View full answer

Get step-by-step solutions from verified subject matter experts