

Question: Hello, please use graph and information to help me find the; The three foremost measures of central tendency ? Variation in the data, including range,
Hello, please use graph and information to help me find the;
The three foremost measures of central tendency ? Variation in the data, including range, quartiles, interquartile range, standard deviation and variance. ? The shape of the data (symmetry and skewness) ? A comparison of the data with what is predicted by the Empirical (normal) rule and the Chebyshev rule. It will help the most if you can also include supporting graphs for ;
table with the mathematical measures of central tendency and variation (DESCRIPTIVE STATISTICS SUMMARY FROM EXCEL)A chart comparing expected and actual results when applying the Empirical (normal) rule and the Chebyshev rule
The data is a record of a persons weight loss over 30 days, the expected data was to plateau at 208, but it seems to be 202 instead
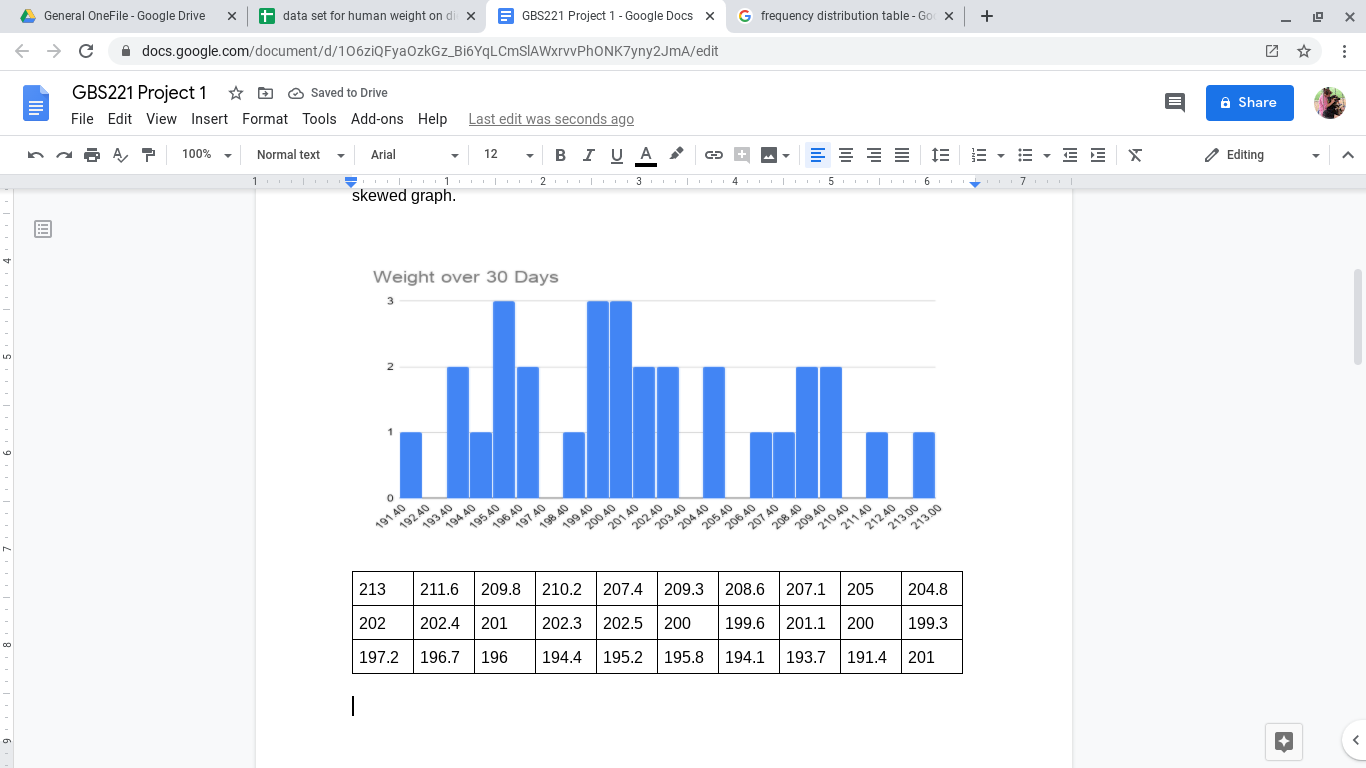
General OneFile - Google Drive X + data set for human weight on di x GBS221 Project 1 - Google Docs X G frequency distribution table - Go( X + X A docs.google.com/document/d/106ziQFyaOzkGz_Bi6YqLCmSIAWxrvvPhONK7yny2JmA/edit . .. GBS221 Project 1 * Saved to Drive File Edit View Insert Format Tools Add-ons Help Last edit was seconds ago & Share 100% Normal text Arial 12 B I U AN GAM. BEEBE BEEX Editing A 1 1 1 1|1 1 skewed graph. 1 1 1|1 1 14 1 1 1 1 1 1 5 1 1 1 1 1 16 1 1 1 1 1 1 7 1 1 1 Weight over 30 Days 3 2 191 40 192 40 193 40 194 40 195 40 196 40 197 40 198.40 199 40 200 40 201 40 202 40 203 40 204 40 205 4 206 40 207 40 208.40 209 40 210 40 211 40 21240 213.00 213.00 213 211.6 209.8 210.2 207.4 209.3 208.6 207.1 205 204.8 202 202.4 201 202.3 202.5 200 199.6 201.1 200 199.3 197.2 196.7 196 194.4 195.2 195.8 194.1 193.7 191.4 201 +
Step by Step Solution
There are 3 Steps involved in it

Get step-by-step solutions from verified subject matter experts