

Question: Figure 1 shows the shaded region between the graph of functions y = cos(rx) and y = sin(Tx) over the interval Find the area
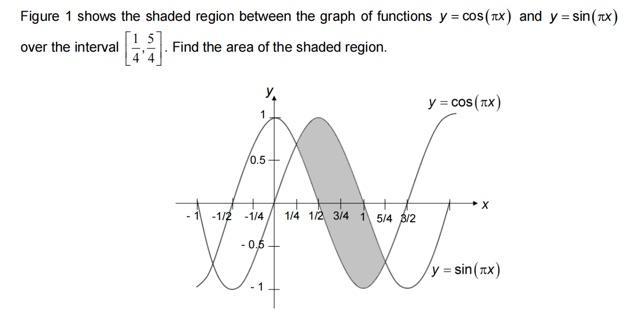
Figure 1 shows the shaded region between the graph of functions y = cos(rx) and y = sin(Tx) over the interval Find the area of the shaded region. y = cos (nx) 0.5 -1/2 -1/4 1/4 1/2 3/4 1 5/4 3/2 - 0,6 y = sin(Tx)
Step by Step Solution
★★★★★
3.51 Rating (151 Votes )
There are 3 Steps involved in it
1 Expert Approved Answer
Step: 1 Unlock

Question Has Been Solved by an Expert!
Get step-by-step solutions from verified subject matter experts
Step: 2 Unlock
Step: 3 Unlock
Document Format (2 attachments)
6362d8aed75d3_237506.pdf
180 KBs PDF File
6362d8aed75d3_237506.docx
120 KBs Word File