

Question: help in E to J!!!!! Presented here are summarized data from the balance sheets and income statements of Wiper, Inc. WIPER, INC. Condensed Balance Sheets
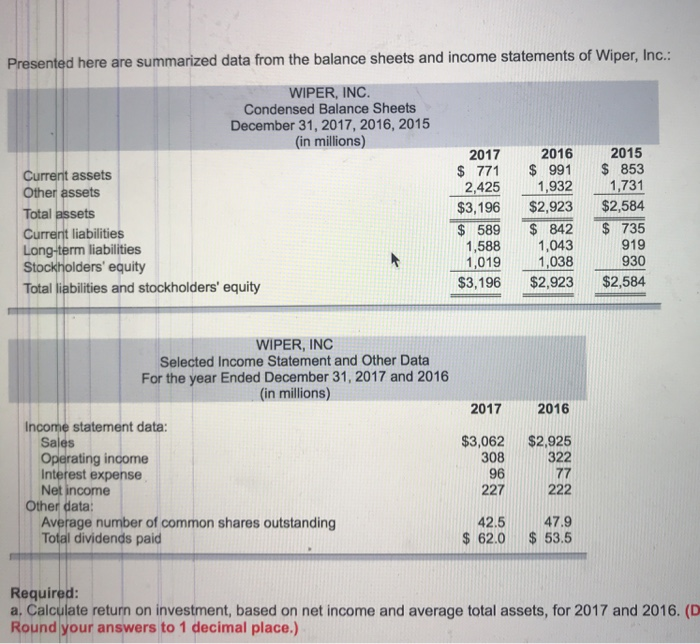
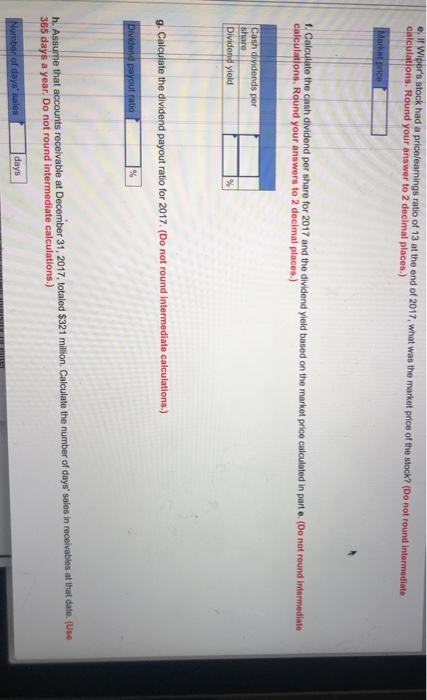
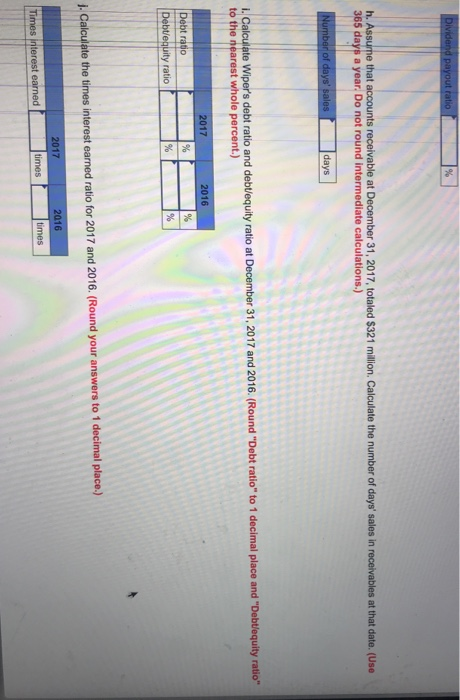
Presented here are summarized data from the balance sheets and income statements of Wiper, Inc. WIPER, INC. Condensed Balance Sheets December 31,2017, 2016, 2015 (in millions) 20162015 991 $ 853 1,731 $3,196 $2,923$2,584 2017 $ 771 Current assets Other assets Total assets 2,425 1,932 Current liabilities Long-term liabilities Stockholders' equity Total liabilities and stockholders' equity 589 S 842 S735 1,588 1,043 ,019 919 930 1,038 $3,196 $2,923$2,584 WIPER, INC Selected Income Statement and Other Data For the year Ended December 31, 2017 and 2016 (in millions) 20172016 Income statement data: $3,062 $2,925 Sales Operating income Interest expense Net income 322 227 222 42.547.9 308 96 Other data: Average number of common shares outstanding Total dividends paid 62.0 $ 53.5 Required: a, Calculate return on investment, based on net income and average total assets, for 2017 and 2016. (D Round your answers to 1 decimal place.) ratio of 13 at the end of 2017, what was the market price of the stock? (Do not round i calculations. Round your answer to 2 decimal places.) d per share for 2017 and the di calculations. Round your answers to 2 decimal places) Cash d g- 365 days a year Do not round intermediate calculations.) to te rearest whole percent) 2016 l- Calculate the times interest earned ratio for 2017 and 2016. (Round your answers to 1 decimal place.) 2017 201
Step by Step Solution
There are 3 Steps involved in it

Get step-by-step solutions from verified subject matter experts