

Question: Please can you help me understand this lesson help me ASAP Berkeley Inc. has decided to use an R -Chart to monitor the changes in
Please can you help me understand this lesson help me ASAP
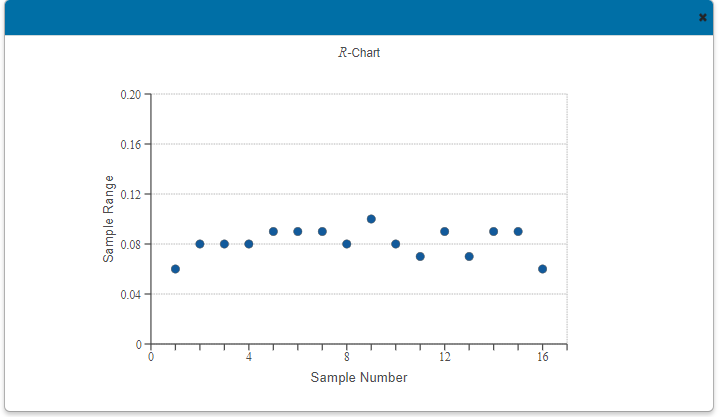
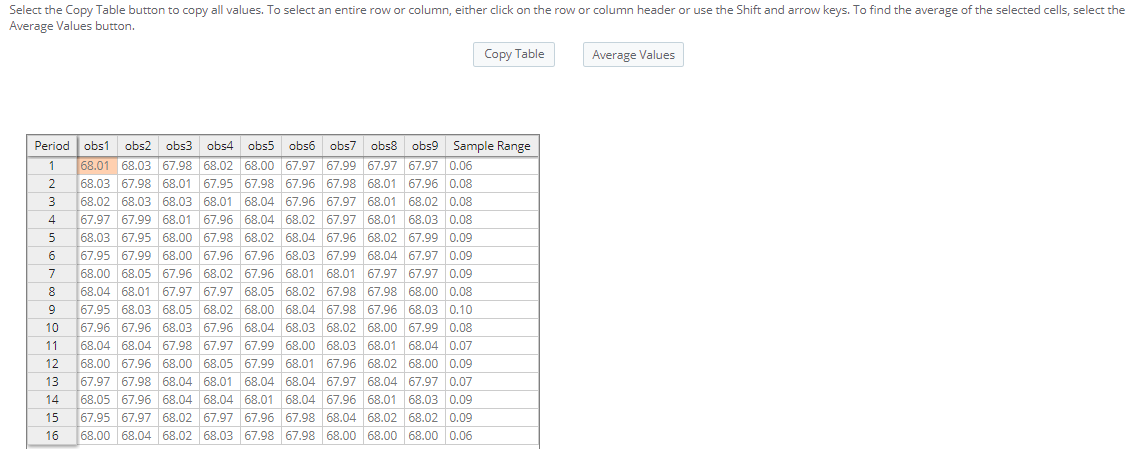
Berkeley Inc. has decided to use an R-Chart to monitor the changes in the variability of their 68.0068.00 pound industrial belts. The production manager randomly samples 99 industrial belts and measures the weight of the sample (in pounds) at 1616 successive time periods.
Here is the table below.
\f\f
Step by Step Solution
There are 3 Steps involved in it
1 Expert Approved Answer
Step: 1 Unlock

Question Has Been Solved by an Expert!
Get step-by-step solutions from verified subject matter experts
Step: 2 Unlock
Step: 3 Unlock