

Question: help please Question Help Data collected on the yearly registrations for a Six Sigma seminar at the Quality College are shown in the following table.
help please 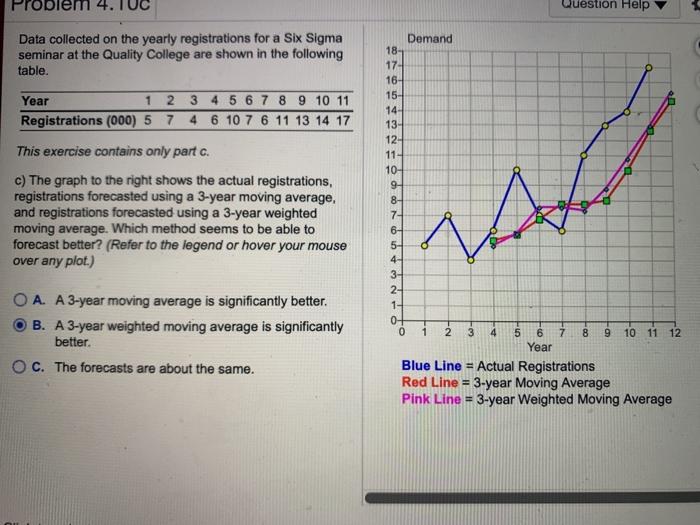
Question Help Data collected on the yearly registrations for a Six Sigma seminar at the Quality College are shown in the following table. Year 1 2 Registrations (000) 5 7 3 4 5 6 7 8 9 10 11 4 6 10 7 6 11 13 14 17 This exercise contains only part c. c) The graph to the right shows the actual registrations, registrations forecasted using a 3-year moving average, and registrations forecasted using a 3-year weighted moving average. Which method seems to be able to forecast better? (Refer to the legend or hover your mouse over any plot.) Demand 18- 17 16- 15 14 13- 12 11 10- 9 8- 7- 6- 5 4 3- 2- 1- 0- 0 1 2 3 4 5 6 7 8 9 10 11 12 Year Blue Line = Actual Registrations Red Line = 3-year Moving Average Pink Line = 3-year Weighted Moving Average Net OA. A 3-year moving average is significantly better. B. A 3-year weighted moving average is significantly better. O C. The forecasts are about the same Step by Step Solution
There are 3 Steps involved in it
1 Expert Approved Answer
Step: 1 Unlock

Question Has Been Solved by an Expert!
Get step-by-step solutions from verified subject matter experts
Step: 2 Unlock
Step: 3 Unlock