

Question: help please with graph B. Temperature effects on reaction rates. 2. a. Show that a plot of ln (time) versus 1 /Temp. should give a
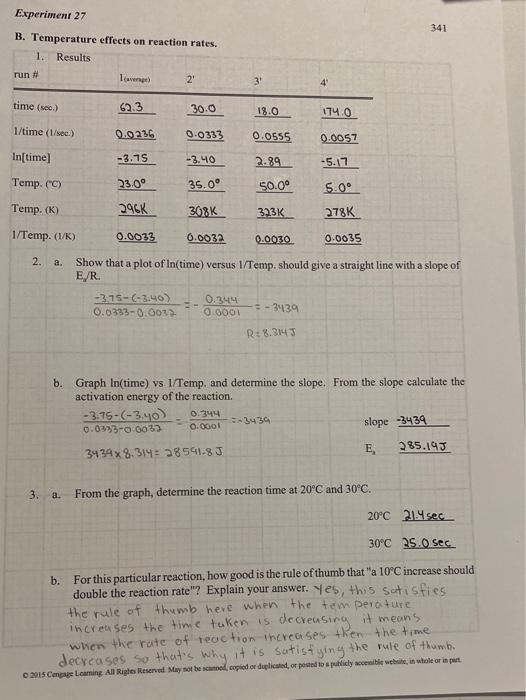
B. Temperature effects on reaction rates. 2. a. Show that a plot of ln (time) versus 1 /Temp. should give a straight line with a slope of E//R 0.03330.00373.75(3.40)=0.00010.344=3439R=8.3147 b. Graph ln (time) vs I/Temp, and determine the slope. From the slope calculate the activation energy of the reaction. 0.03330.00323.75(3.40)=0.00010.344=343934398.314=28591.8Jslope3439E2285.19J 3. a. From the graph, determine the reaction time at 20C and 30C. 20C21.4sec 30C25.0sec b. For this particular reaction, how good is the rule of thumb that " 10C increase should double the reaction rate"? Explain your answer. Yes, this satisfies the rule of thumb heve when the tem perature increases the time taken is decreasing it means when the rate of reaction increases then the time decreases so that's why it is satistying the rule of thumb
Step by Step Solution
There are 3 Steps involved in it

Get step-by-step solutions from verified subject matter experts