

Question: Help plz : Lamar is a budding climate scientist and is analyzing historical data on the noontime temperature on each of two dates (Date 1
Help plz :\
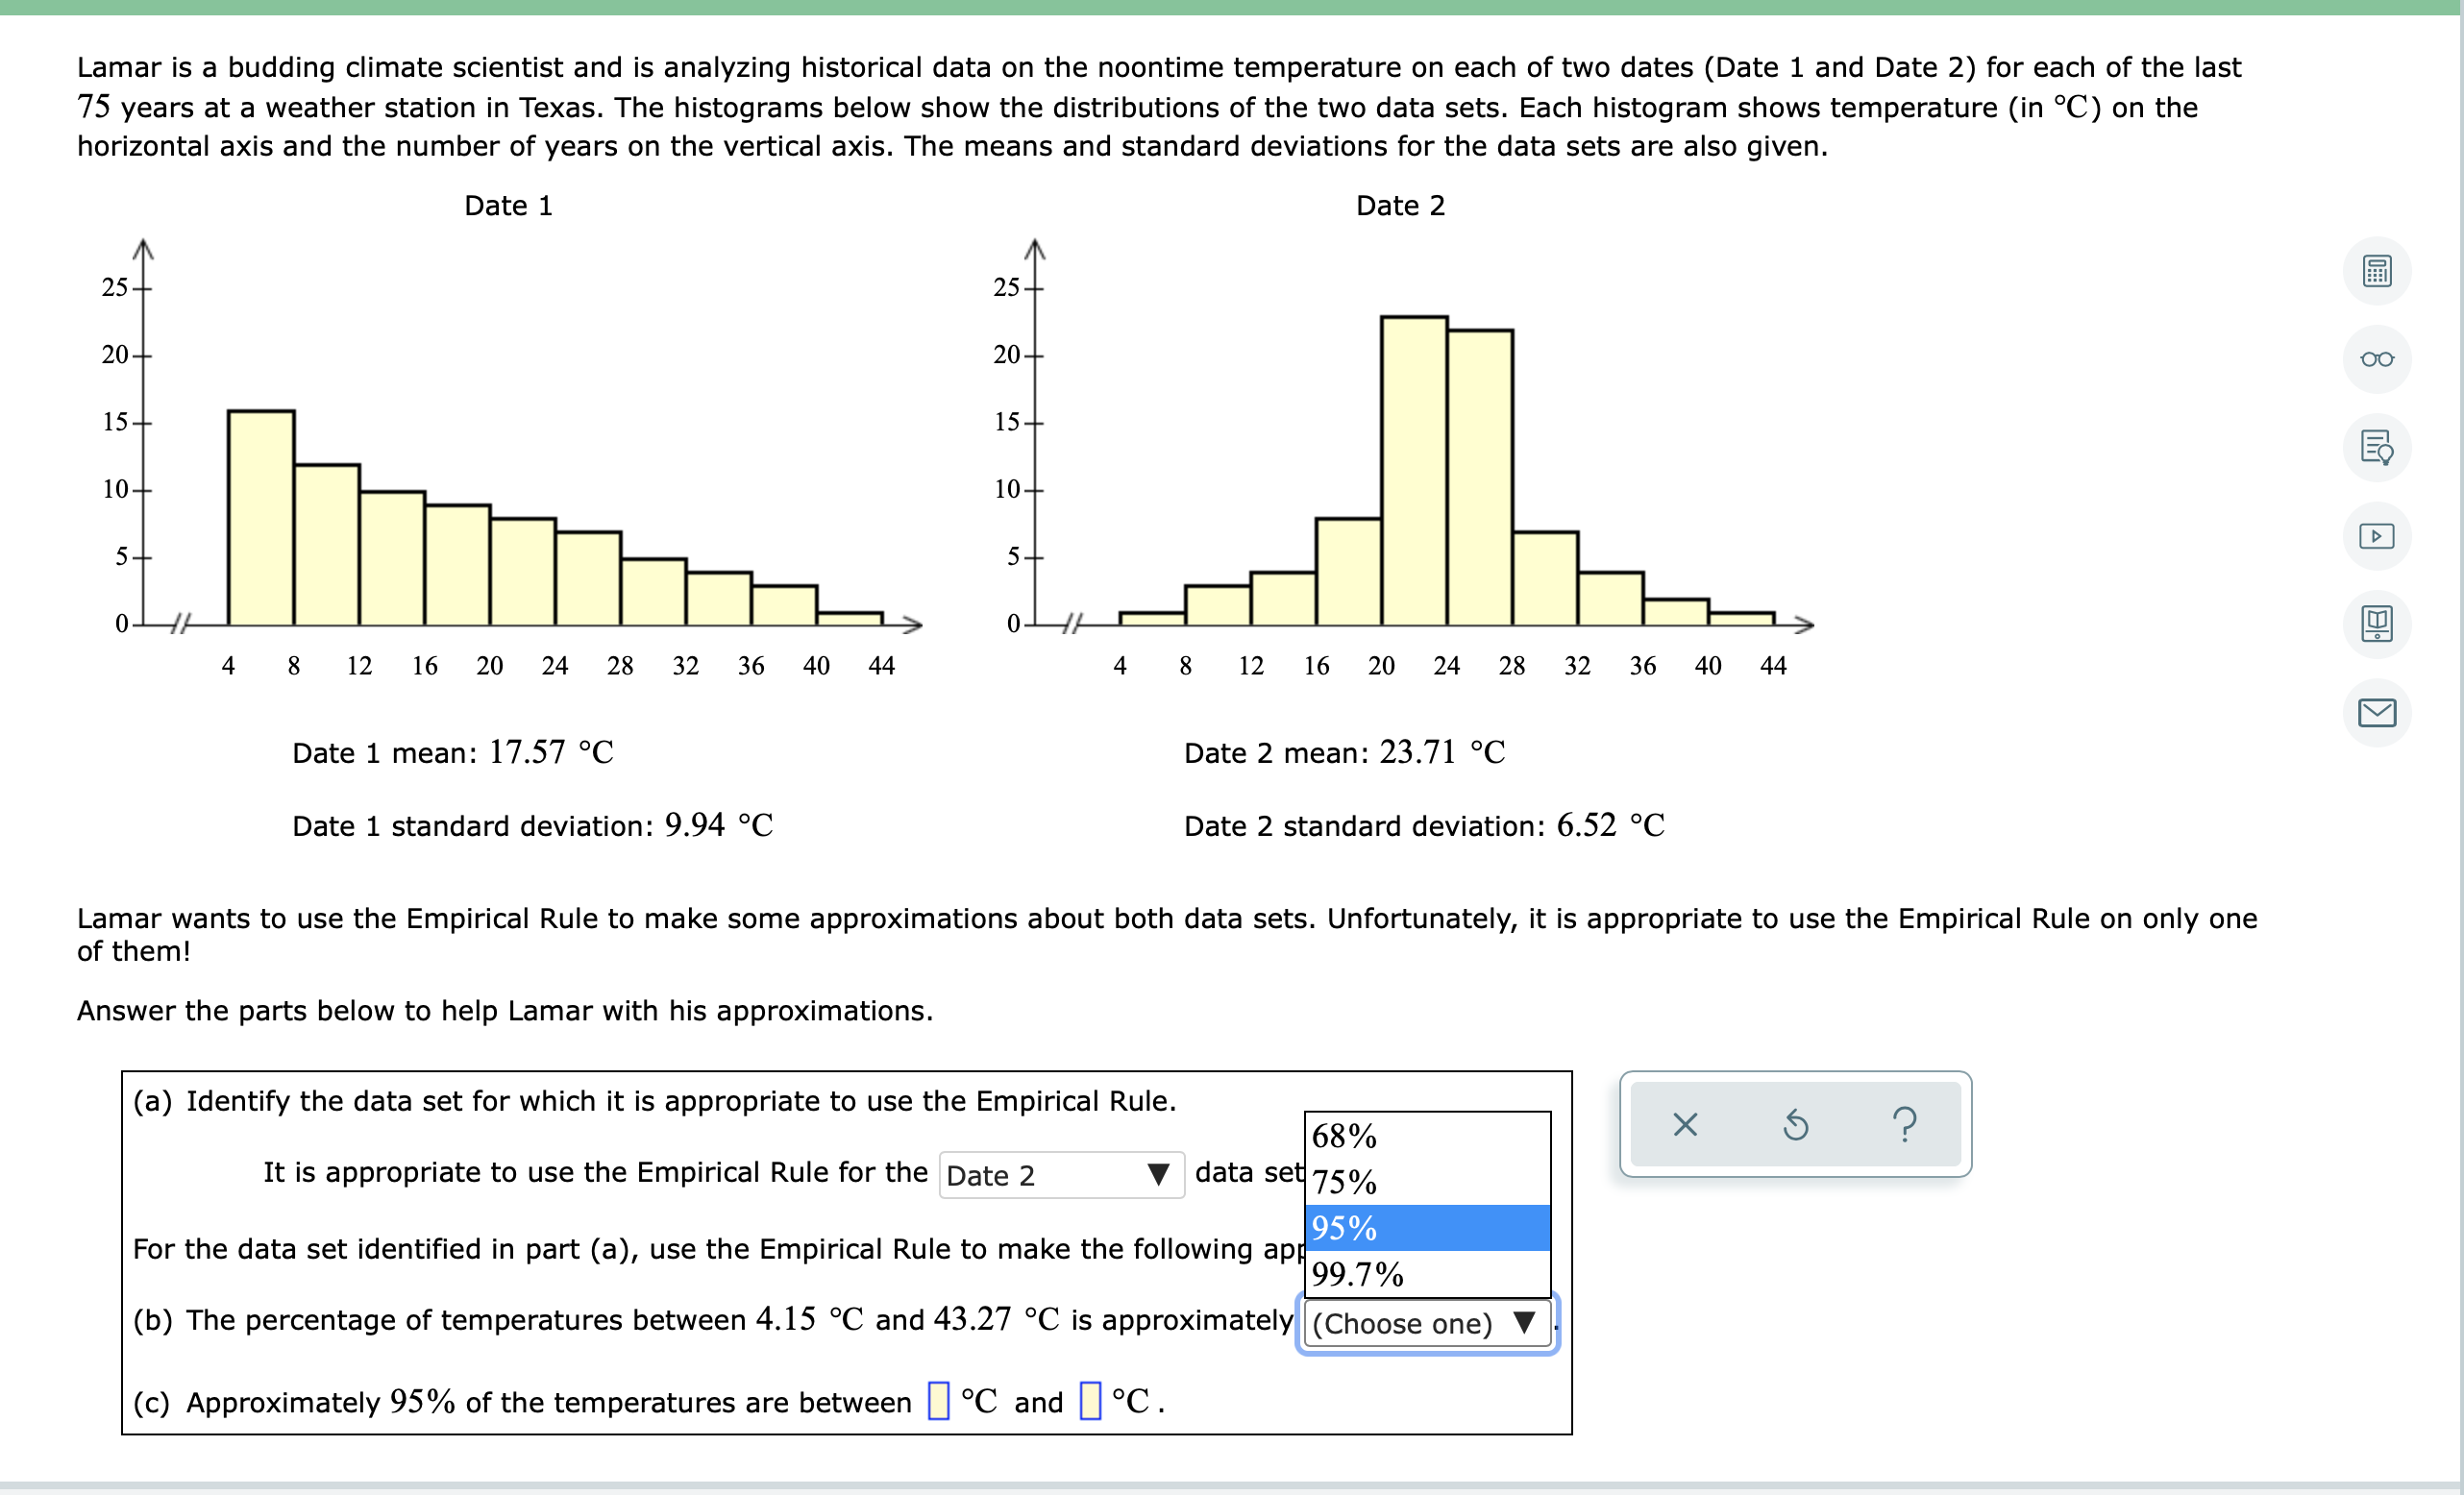
Lamar is a budding climate scientist and is analyzing historical data on the noontime temperature on each of two dates (Date 1 and Date 2) for each of the last 75 years at a weather station in Texas. The histograms below show the distributions of the two data sets. Each histogram shows temperature (in C) on the horizontal axis and the number of years on the vertical axis. The means and standard deviations for the data sets are also given. Date 1 25 20 15 10 4 8 12 16 20 24 28 32 36 4044 Date 1 mean: 17.57 C Date 1 standard deviation: 9.94 C Date 2 25 20 4 8 12 16 2024 28 32 364044 Date 2 mean: 23.71 C Date 2 standard deviation: 6.52 \"C Lamar wants to use the Empirical Rule to make some approximations about both data sets. Unfortunately, it is appropriate to use the Empirical Rule on only one of them! Answer the parts below to help Lamar with his approximations. (a) Identify the data set for which it is appropriate to use the Empirical Rule. It is appropriate to use the Empirical Rule for the Date 2 V data se- For the data set identied in part (a), use the Empirical Rule to make the following ap (b) The percentage of temperatures between 4.15 C and 43.27 C is approximatelyl (Choose one) V l (c) Approximately 95% of the temperatures are between D C and I] C
Step by Step Solution
There are 3 Steps involved in it

Get step-by-step solutions from verified subject matter experts