

Question: Help Problem 9-1 Here are comparative statement data for Sheridan Company and Crane Company, two competitors. All balance sheet data are as of December 31,
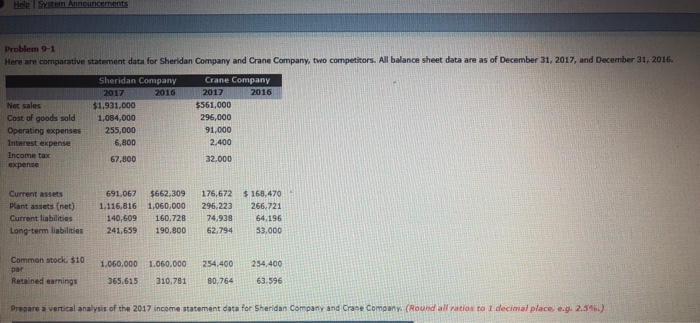
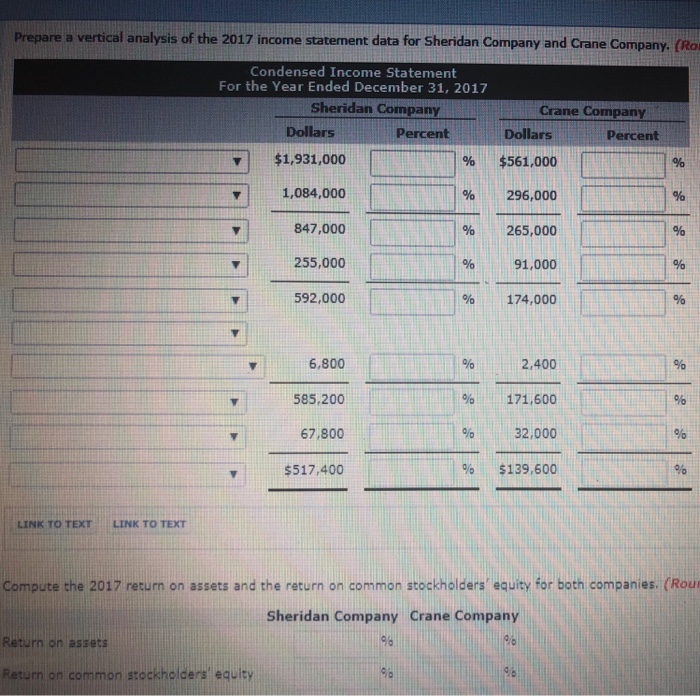
Help Problem 9-1 Here are comparative statement data for Sheridan Company and Crane Company, two competitors. All balance sheet data are as of December 31, 2017, and December 31, 2016. Sheridan Company 2016 Crane Company 2017 2017 Net sales $1.931.000 Cost of goods sold 1,084,000 Operating expenses255,000 6,800 67,800 $561,000 296,000 91,000 2,400 32,000 Interest expense Income tax expense 691.067 $662.309 176.672 %168.470. Current assets Plant assets (net)1,116,816 1,060,000 296,223 266,721 Current liabilities Long-term liabilities241.659 190.800 62,79453,000 140,609160,728 74.938 64.196 Common stock $10 1060.000 1.060,000 254.400254 Retained eamings 365,615 310.78180.764 Prepare a vertical analysis of the 2017 income statement data for Sheridan Company and Crane Company. (Round all ratios to 1 decimal place, eg. 2-5%.) par 365,615 310,78180,764 63.596
Step by Step Solution
There are 3 Steps involved in it

Get step-by-step solutions from verified subject matter experts