

Question: *Problem 13-1A Here are comparative statement data for Sheridan Company and Crane Company, two competitors. All balance sheet data are as of D r31, 2019,
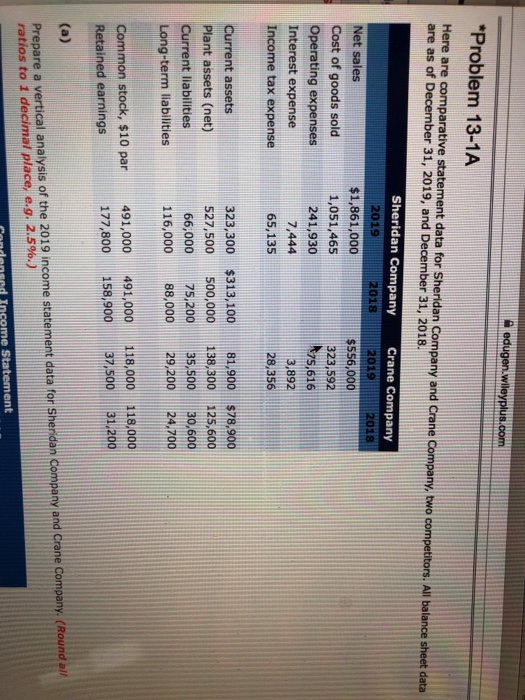
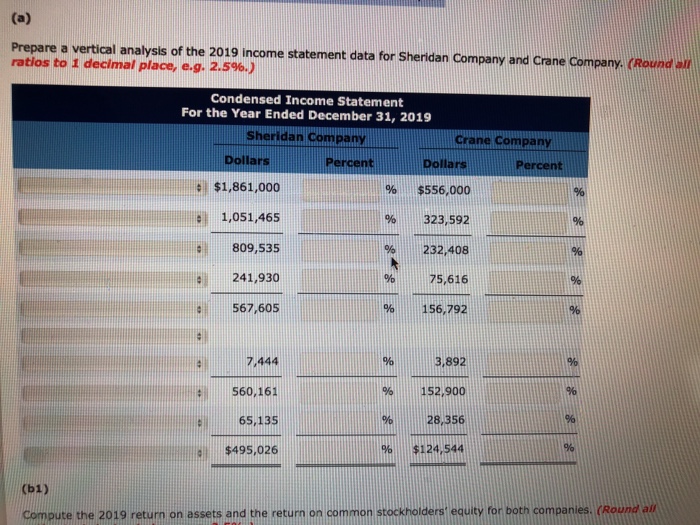
*Problem 13-1A Here are comparative statement data for Sheridan Company and Crane Company, two competitors. All balance sheet data are as of D r31, 2019, and December 31, 2018 Sheridan Company Crane Company 2019 2018 2019 2018 Net sales Cost of goods sold Operating expenses Interest expense Income tax expense $1,861,000 1,051,465 241,930 7,444 65,135 $556,000 323,592 875,616 3,892 28,356 Current assets Plant assets (net) Current liabilities Long-term liabilities 323,300 $313,10081.900 $78,900 527,500 500,000 138,300125,600 66,00075,200 35,soo 30,600 116,000 88,00029,20024.700 491,000 177,800 158,90037,50031.200 491,000118,000 118,000 Common stock, $10 par Retained earnings Prepare a vertical analysis of the 2019 income statement data for Sheridan Company and Crane Company. (Round all ratios to 1 decimal place, eg. 2.5%.) andeneed Income
Step by Step Solution
There are 3 Steps involved in it

Get step-by-step solutions from verified subject matter experts