

Question: Here are comparative statement data for Sheridan Company and Crane Company, two competitors. All balance sheet data are as of December 31, 2022, and December
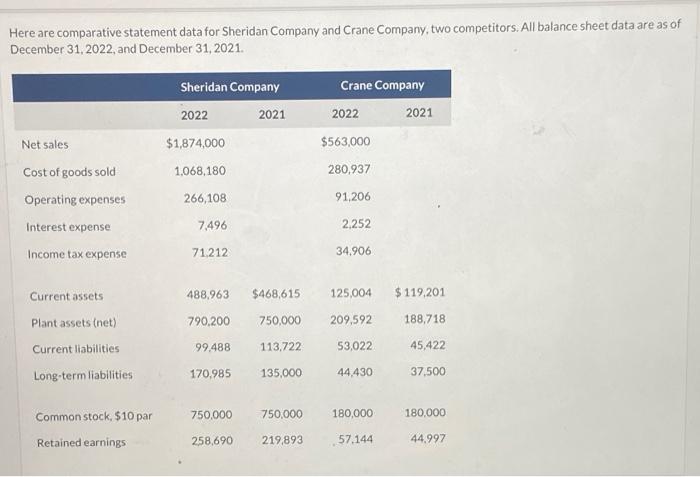
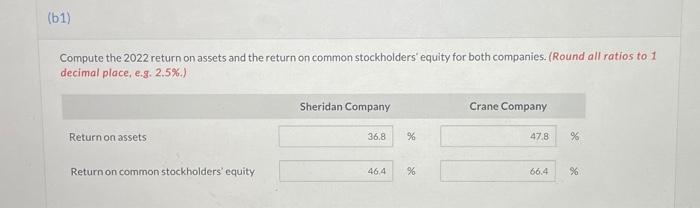
Here are comparative statement data for Sheridan Company and Crane Company, two competitors. All balance sheet data are as of December 31, 2022, and December 31, 2021. Sheridan Company 2022 2021 $1,874,000 Crane Company 2022 2021 $563,000 Net sales Cost of goods sold Operating expenses 1,068,180 280,937 266,108 91,206 Interest expense 7,496 2.252 Income tax expense 71.212 34,906 488,963 $468,615 125,004 $ 119,201 Current assets Plant assets (net) Current liabilities 790,200 750,000 209,592 188,718 99.488 113,722 53,022 45,422 170.985 Long-term liabilities 135,000 44,430 37.500 Common stock, $10 par 750,000 750,000 180,000 180,000 258,690 Retained earnings 219,893 57.144 44.997 (61) Compute the 2022 return on assets and the return on common stockholders' equity for both companies. (Round all ratios to 1 decimal place, e.g. 2.5%) Sheridan Company Crane Company Return on assets 36,8 % 47.8 % Return on common stockholders' equity 464 % 66.4 6
Step by Step Solution
There are 3 Steps involved in it

Get step-by-step solutions from verified subject matter experts