Question: Help solving this problem Help solving this problem question 5 data table for the concert sales data Save per ads promoting the concerts for a
Help solving this problem
Help solving this problem question 5
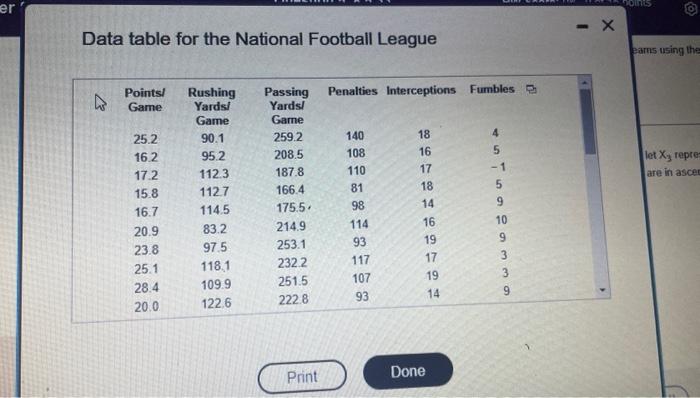
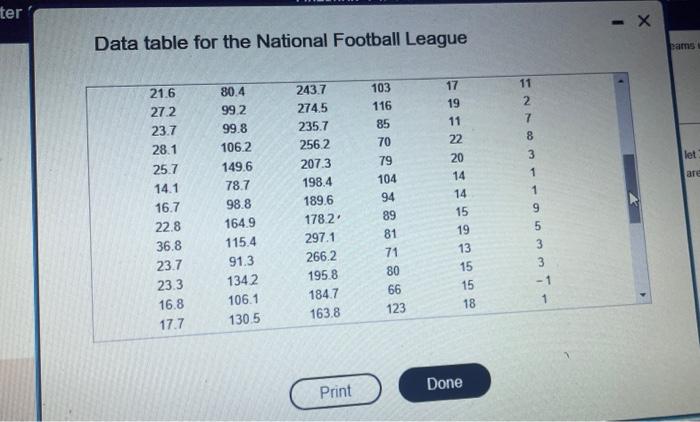
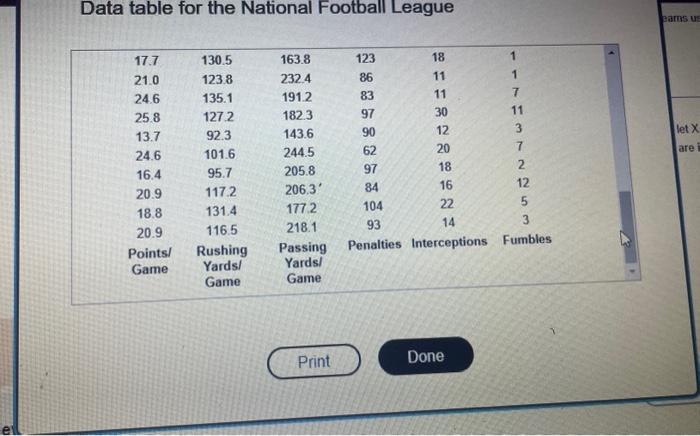


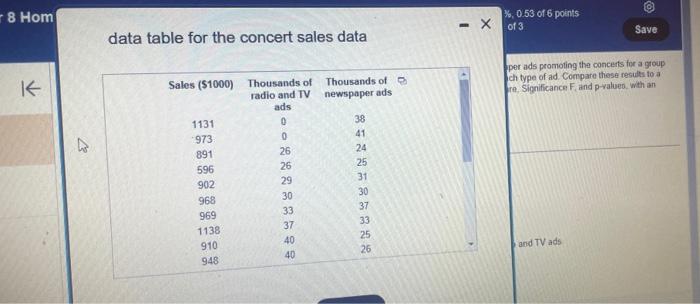
data table for the concert sales data Save per ads promoting the concerts for a group ch type of ad. Compare these results to a re. Significance F, and p-raluevo. wth an. Using the accompanying Concert Sales data on sales dollars and the number of radio, TV, and newspaper ads promoting the concerts for a group of cities. Develop simple linear regression models for predicting sales as a function of the number of each type of ad. Compare these results to a multiple linear regression model using both independent variables. State the model and explain R-square, Significance F, and p-values, with an alpha of 0.05. Click the icon to viaw the Concert Sales data. State the hypotheses for the simple linear regression tests H0:1=0H1:1=0 State the model predicting ConcertSales as a function of Radio\&TV, the number (in thousands) of radio and TV ads. ConcertSales =+ Radio\&TV (Type integers or decimals rounded to three decimal places as needed) Data table for the National Football League Data table for the National Football League Data table for the National Football League Use the p-value criterion to find the best model for predicting the number of points scored per game by fooiball teams using the accompanying National Football League Data. Does the model make logical sense? Click the icon to view the National Football League Data. Determine the best multiple regression model. Let X1 represent Rushing Yards, iet X2 represent Passing Yards, let X3 represent Penatios, It X4 represent Interceptions, and let X5 represent Fumbles. Enter the terms of the equation so that the Xk-values are in ascending numeral order by base. Select the correct choice below and fill in the answer boxes within your choice. (Type an integer or decimal rounded to three decimal places as needed.) A. Points/Game = B. Points/Game = C. Points/Game = n. Points/Game = Use the p-value criterion to find the best model for predicting the number of points scored per game by lootbal taama uring the sccomparying National Football League Data Does the model make logical sense? Click the icon to view the National Football League Data. (Type an integer or decimal roundid to three decimal places as needed) A. Points/Game = B. Points/Game = C. Points/Game = D. Points/Game = E. Points/Game = data table for the concert sales data Save per ads promoting the concerts for a group ch type of ad. Compare these results to a re. Significance F, and p-raluevo. wth an. Using the accompanying Concert Sales data on sales dollars and the number of radio, TV, and newspaper ads promoting the concerts for a group of cities. Develop simple linear regression models for predicting sales as a function of the number of each type of ad. Compare these results to a multiple linear regression model using both independent variables. State the model and explain R-square, Significance F, and p-values, with an alpha of 0.05. Click the icon to viaw the Concert Sales data. State the hypotheses for the simple linear regression tests H0:1=0H1:1=0 State the model predicting ConcertSales as a function of Radio\&TV, the number (in thousands) of radio and TV ads. ConcertSales =+ Radio\&TV (Type integers or decimals rounded to three decimal places as needed) Data table for the National Football League Data table for the National Football League Data table for the National Football League Use the p-value criterion to find the best model for predicting the number of points scored per game by fooiball teams using the accompanying National Football League Data. Does the model make logical sense? Click the icon to view the National Football League Data. Determine the best multiple regression model. Let X1 represent Rushing Yards, iet X2 represent Passing Yards, let X3 represent Penatios, It X4 represent Interceptions, and let X5 represent Fumbles. Enter the terms of the equation so that the Xk-values are in ascending numeral order by base. Select the correct choice below and fill in the answer boxes within your choice. (Type an integer or decimal rounded to three decimal places as needed.) A. Points/Game = B. Points/Game = C. Points/Game = n. Points/Game = Use the p-value criterion to find the best model for predicting the number of points scored per game by lootbal taama uring the sccomparying National Football League Data Does the model make logical sense? Click the icon to view the National Football League Data. (Type an integer or decimal roundid to three decimal places as needed) A. Points/Game = B. Points/Game = C. Points/Game = D. Points/Game = E. Points/Game =