

Question: help with matlab please! Problem 5 For the same equation as above: Create a new plot with 2 new curves where P_13 kept constant and
help with matlab please!
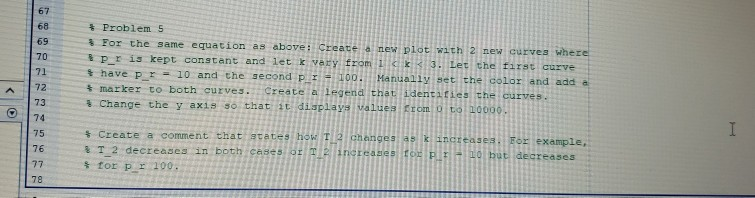
Problem 5 For the same equation as above: Create a new plot with 2 new curves where P_13 kept constant and let k vary from ICE 3. Let the first curve have P1 - 10 and the second P7100. Manually set the color and add a marker to both curves. Create a Legend that identifies the curves. Change the y ax18 so that it displays les from 0 to 10000 Create a comment that states how T2 changes increases. For example, # T_2 decreases in both cases or TA increases for FLFL Lo but decreases #tor pr 100
Step by Step Solution
There are 3 Steps involved in it
1 Expert Approved Answer
Step: 1 Unlock

Question Has Been Solved by an Expert!
Get step-by-step solutions from verified subject matter experts
Step: 2 Unlock
Step: 3 Unlock