

Question: help with part b only. An automatic lathe produces rollers for roller bearings, and the process is mignitored by statistical process control charts. The central
help with part b only. 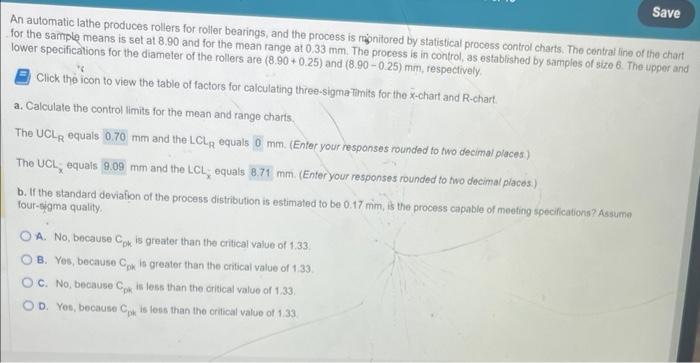
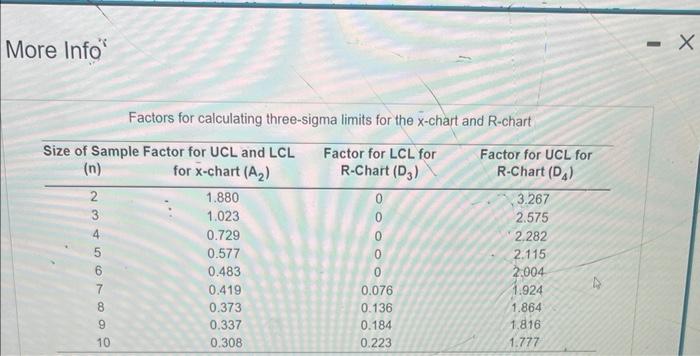
An automatic lathe produces rollers for roller bearings, and the process is mignitored by statistical process control charts. The central line of the chart for the sample means is set at 8.90 and for the mean range at 0.33mm. The process is in control, as established by samples of size 6 . The upper an lower specifications for the diameter of the rollers are (8.90+0.25) and (8.900.25)mm, respectively. Click the icon to view the table of factors for calculating three-sigma Timits for the x-chart and R-chart. a. Calculate the control limits for the mean and range charts. The UCLR equals mm and the LCLR equals mm. (Enter your responses rounded fo two decimal places) The UCL- x equals mm and the LCLx equals 8.71mm. (Enter your responses rounded to two decimal places.) b. If the standard four-sigma quality. A. No, because Cpk is greater than the critical value of 1.33 B. Yes, because Cok is greater than the critical value of 1:33. C. No, because Cpk is less than the critical value of 1.33; D. Yes, because Cpk is less than the oritical value of 1.33 More Info" Factors for calculating three-sigma limits for the x-chart and R-chart
Step by Step Solution
There are 3 Steps involved in it
1 Expert Approved Answer
Step: 1 Unlock

Question Has Been Solved by an Expert!
Get step-by-step solutions from verified subject matter experts
Step: 2 Unlock
Step: 3 Unlock