

Question: Here are comparative statement data for Duke Company and Lord Company, two competitors. All balance sheet data are as of December 31, 2020, and December
Here are comparative statement data for Duke Company and Lord Company, two competitors. All balance sheet data are as of December 31, 2020, and December 31, 2019.
| Duke Company | Lord Company | |||||||
| 2020 | 2019 | 2020 | 2019 | |||||
| Net sales | $1,830,000 | $559,000 | ||||||
| Cost of goods sold | 1,099,830 | 296,829 | ||||||
| Operating expenses | 269,010 | 78,260 | ||||||
| Interest expense | 7,320 | 3,913 | ||||||
| Income tax expense | 54,900 | 6,149 | ||||||
| Current assets | 323,000 | $312,700 | 83,200 | $79,200 | ||||
| Plant assets (net) | 519,300 | 500,600 | 139,200 | 124,200 | ||||
| Current liabilities | 65,200 | 75,200 | 36,800 | 28,600 | ||||
| Long-term liabilities | 108,000 | 90,000 | 29,800 | 26,000 | ||||
| Common stock, $10 par | 500,000 | 500,000 | 117,000 | 117,000 | ||||
| Retained earnings | 169,100 | 148,100 | 38,800 | 31,800 | ||||
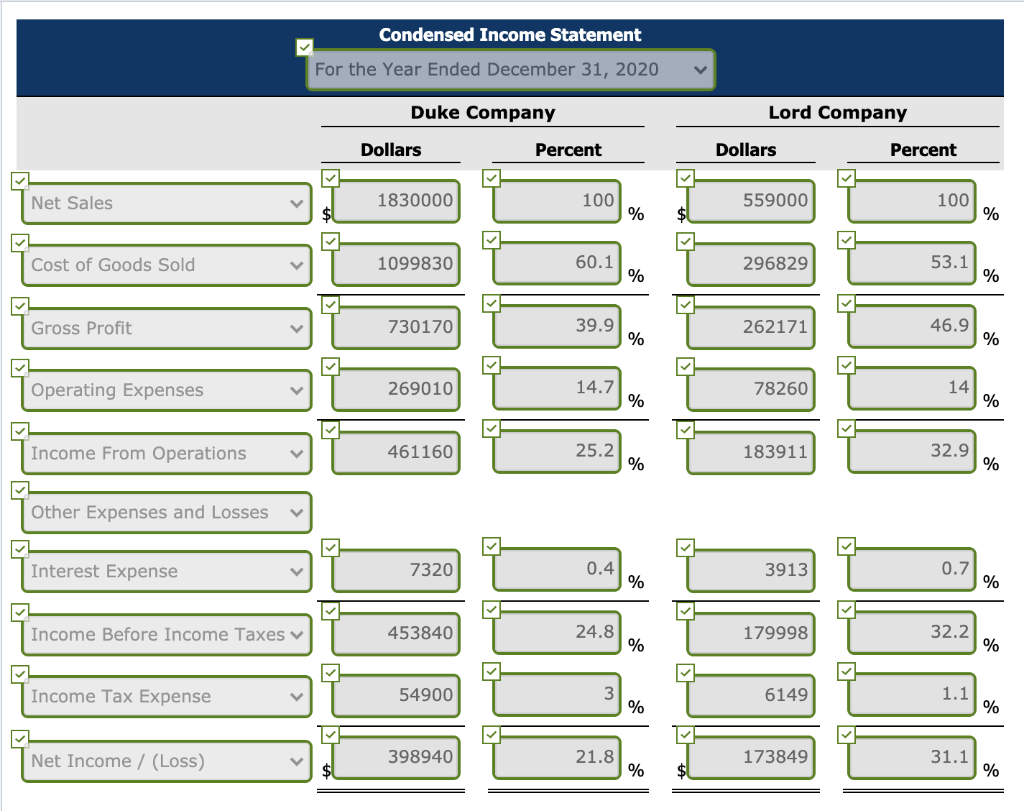
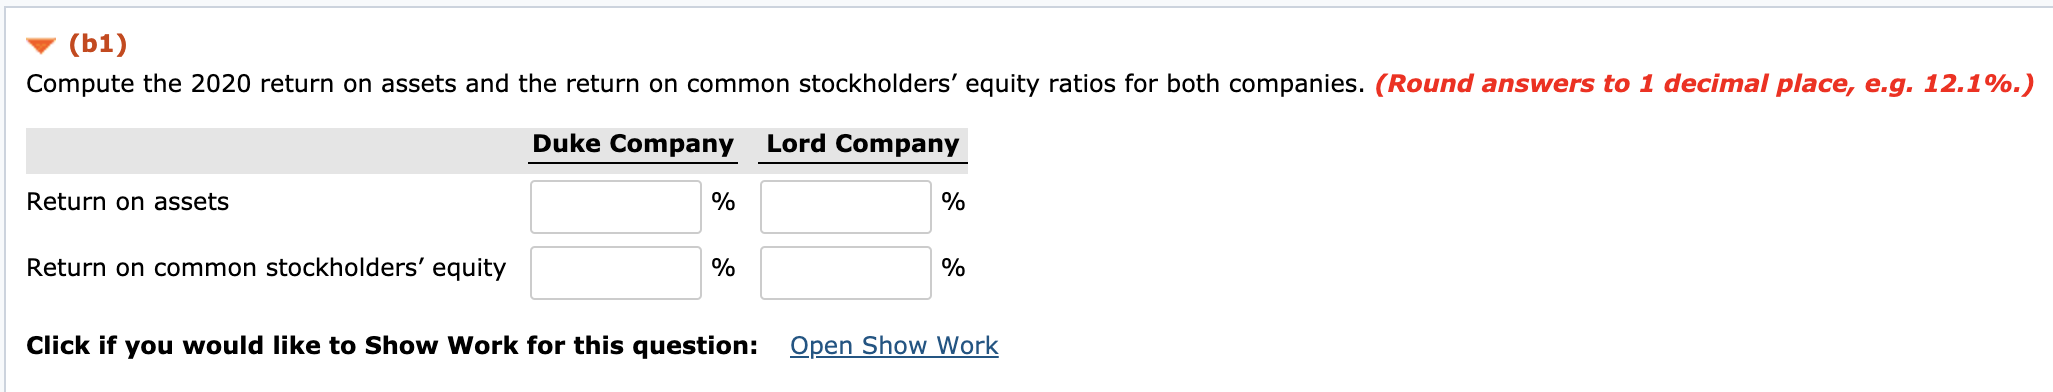
Condensed Income Statement For the Year Ended December 31, 2020 Duke Company Lord Company Dollars Percent Dollars Percent Net Sales 1830000 100 559000 100 % $ % Cost of Goods Sold 1099830 60.1 296829 53.1 % % Gross Profit 730170 39.9 262171 46.9 % % Operating Expenses 269010 14.7 78260 14 % % Income From Operations 461160 25.2 183911 32.9 % % Other Expenses and Losses Interest Expense 7320 0.4 3913 0.7 % % Income Before Income Taxes 453840 24.8 179998 32.2 % % Income Tax Expense 54900 3 % 6149 1.1 % Net Income / (Loss) 398940 21.8 173849 31.1 % % (b1) Compute the 2020 return on assets and the return on common stockholders' equity ratios for both companies. (Round answers to 1 decimal place, e.g. 12.1%.) Duke Company Lord Company Return on assets % % Return on common stockholders' equity % % Click if you would like to Show Work for this question: Open Show Work
Step by Step Solution
There are 3 Steps involved in it

Get step-by-step solutions from verified subject matter experts