

Question: Here is a bivariate data set. x y 30.9 21.4 61.4 29.9 38 -8 53.6 -13.5 37.9 32.2 65.1 67.1 17.1 -46.7 28.3 0.4
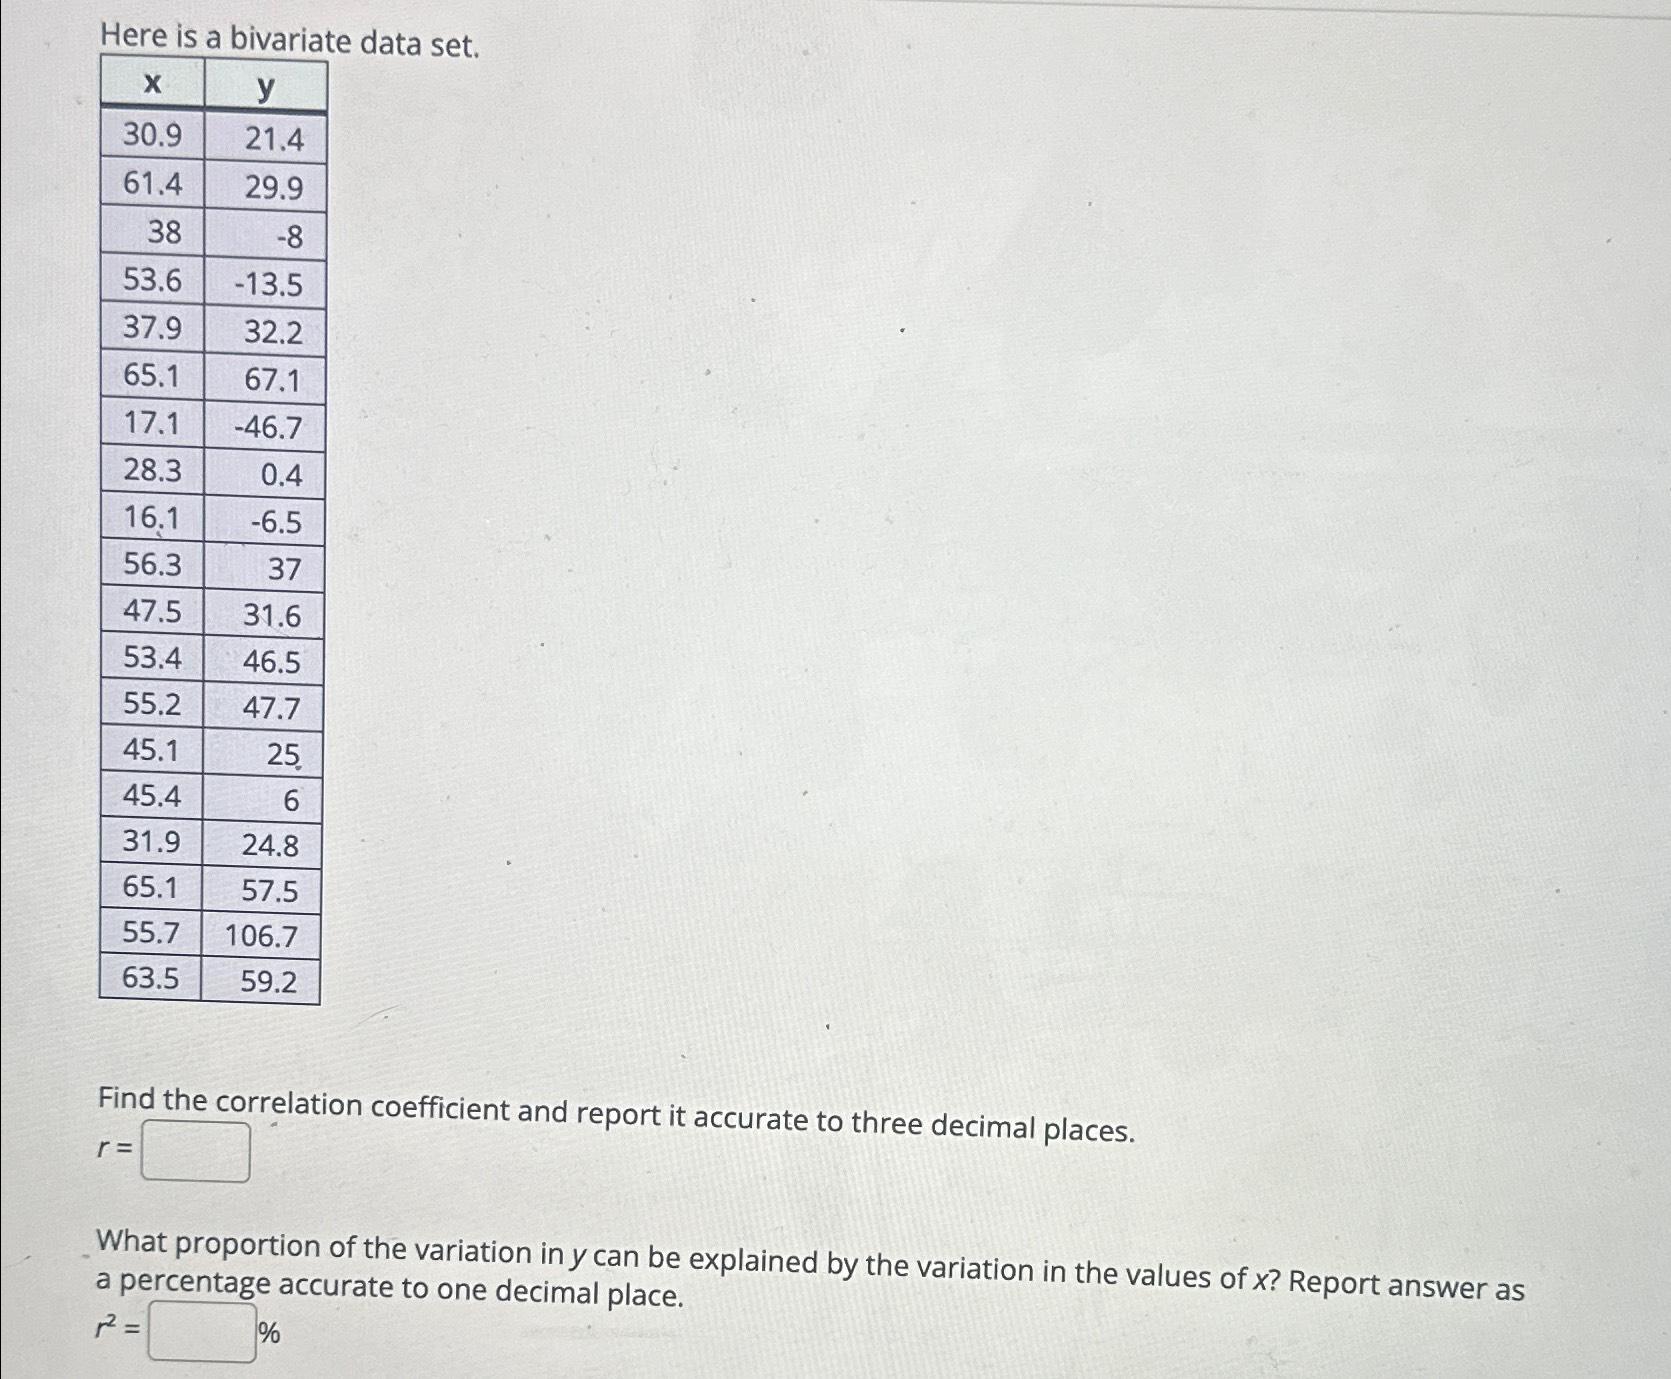
Here is a bivariate data set. x y 30.9 21.4 61.4 29.9 38 -8 53.6 -13.5 37.9 32.2 65.1 67.1 17.1 -46.7 28.3 0.4 16.1 -6.5 56.3 37 47.5 31.6 53.4 46.5 55.2 47.7 45.1 25 45.4 6 31.9 24.8 65.1 57.5 55.7 106.7 63.5 59.2 Find the correlation coefficient and report it accurate to three decimal places. r = What proportion of the variation in y can be explained by the variation in the values of x? Report answer as a percentage accurate to one decimal place. 22 = %
Step by Step Solution
There are 3 Steps involved in it
1 Expert Approved Answer
Step: 1 Unlock

Question Has Been Solved by an Expert!
Get step-by-step solutions from verified subject matter experts
Step: 2 Unlock
Step: 3 Unlock