

Question: Here is data withy as the response variable. Make a scatter plot of this data. Which point visually looks like it is an outlier? '
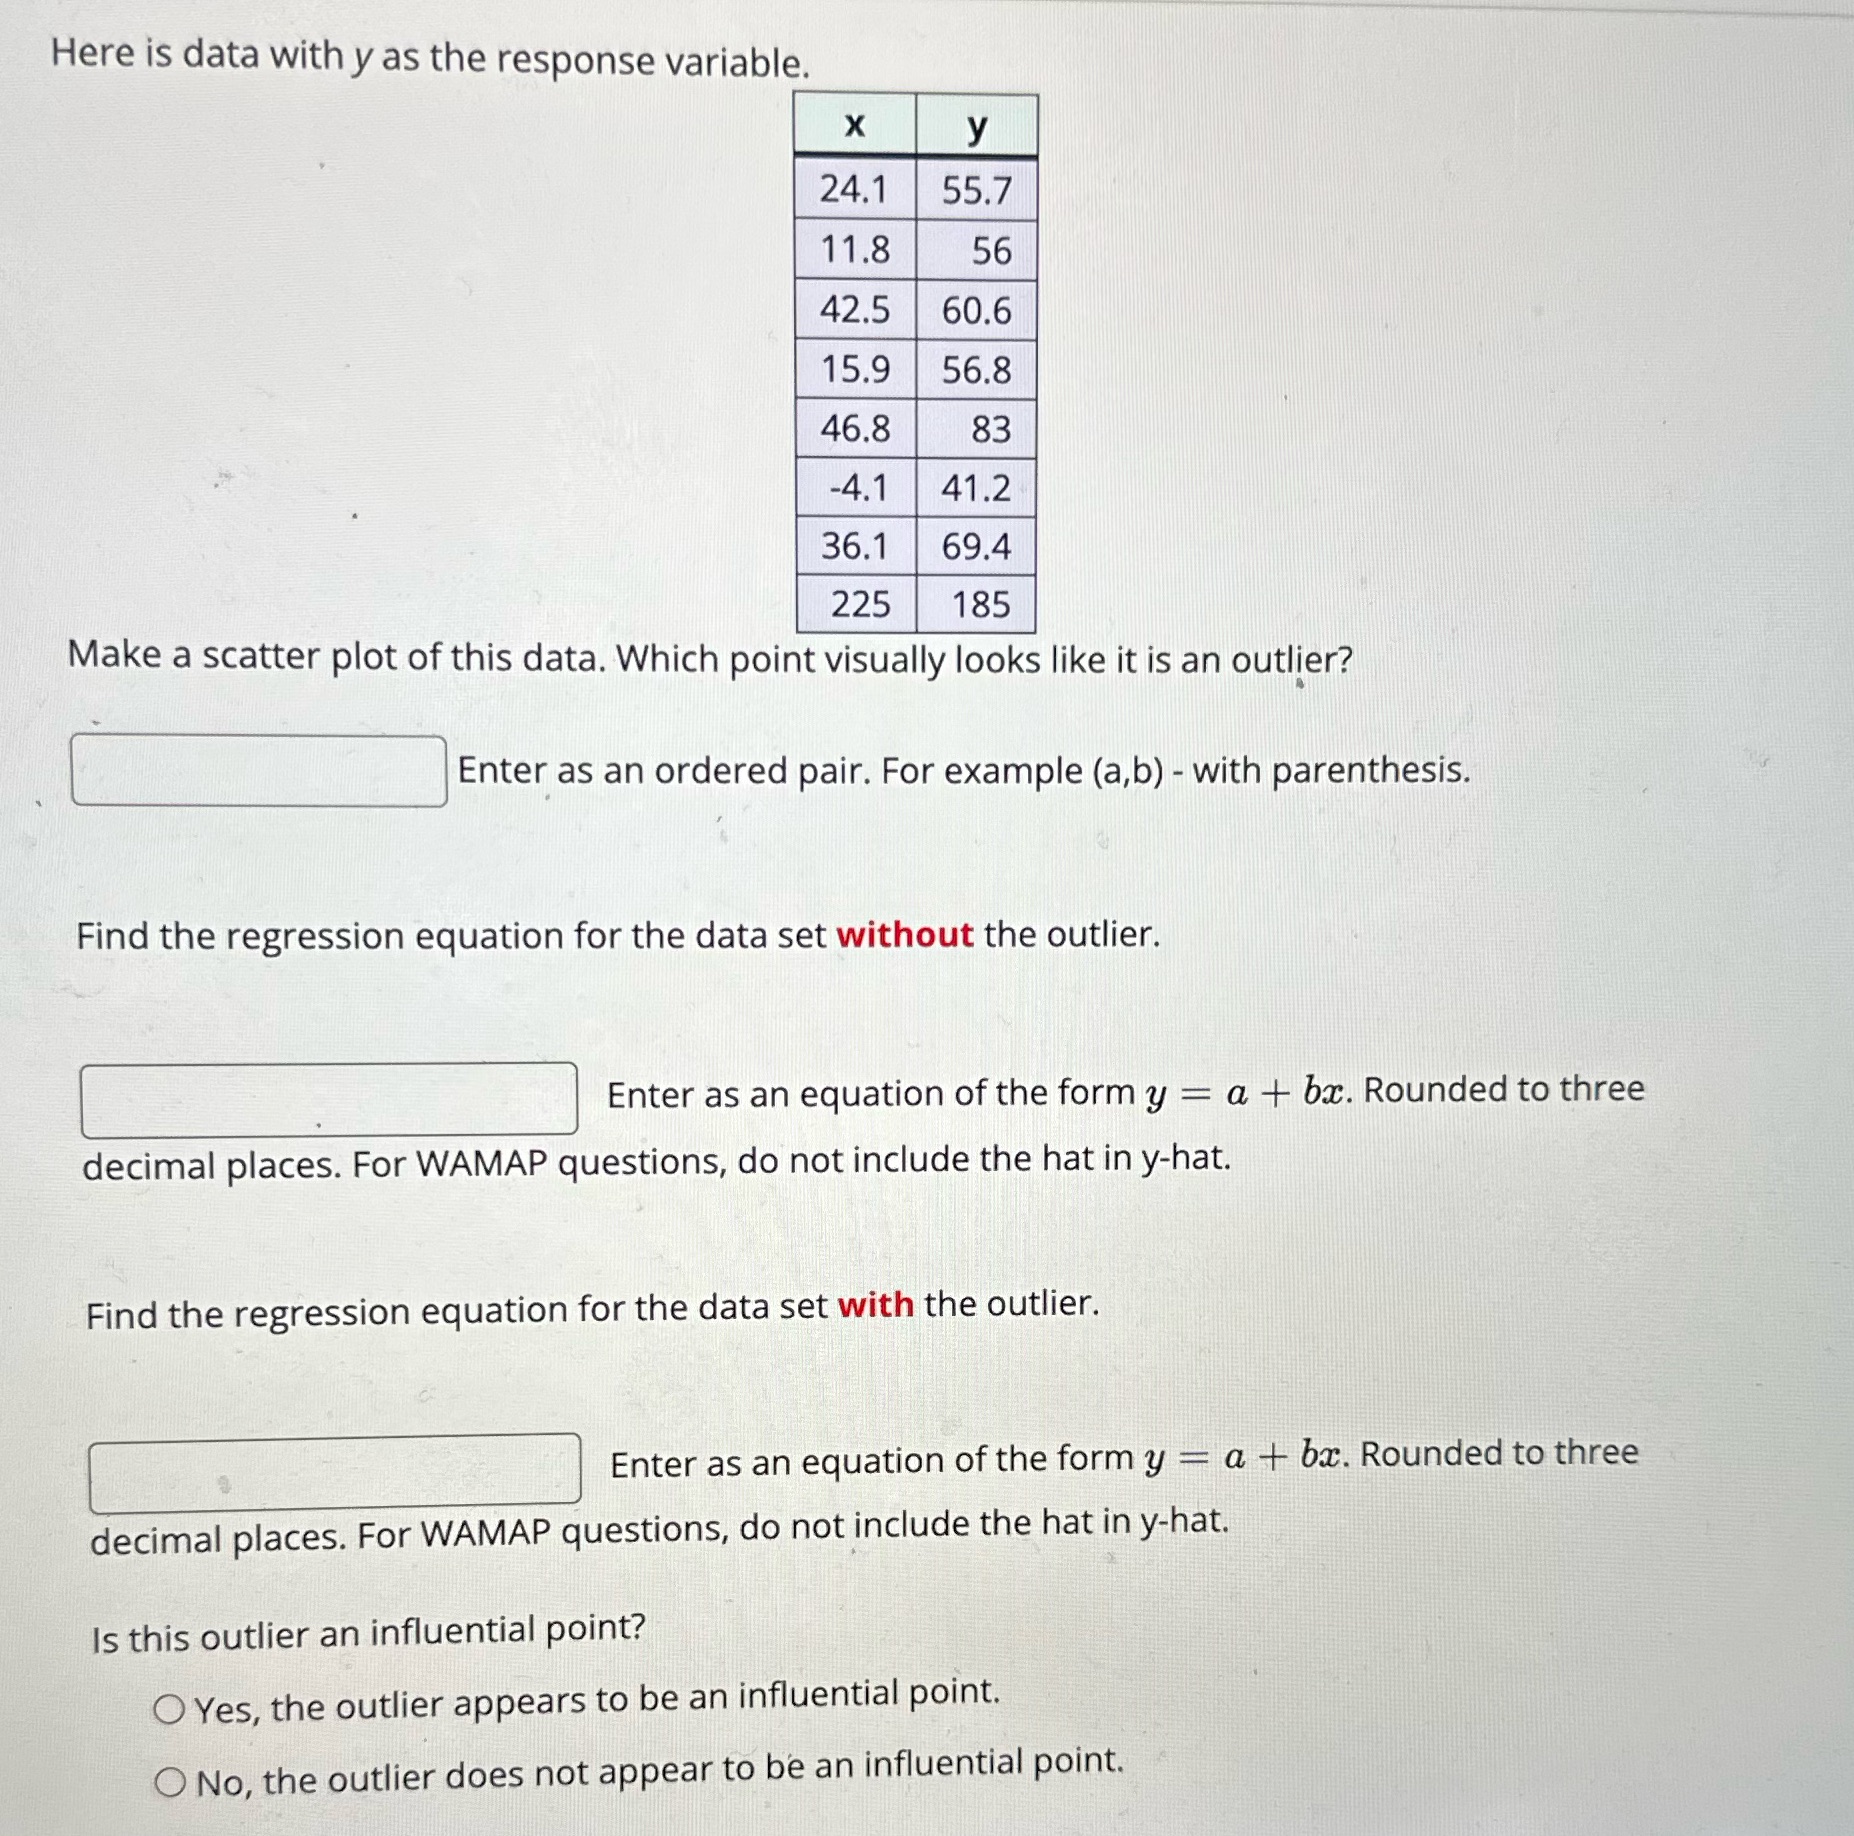
Here is data withy as the response variable. Make a scatter plot of this data. Which point visually looks like it is an outlier? ' E Enter as an ordered pair. For example (a,b) with parenthesis. Find the regression equation for the data set without the outlier. Enter as an equation of the form 3; = a + bx. Rounded to three decimal places. For WAMAP questions, do not include the hat in yhat. Find the regression equation for the data set with the outlier. Enter as an equation of the form y = a. + bx. Rounded to three decimal places. For WAMAP questions, do not include the hat in y-hat. is this outlier an inuential point? 0 Yes, the outlier appears to be an inuential point. 0 No, the outlier does not appear to be an inuential point
Step by Step Solution
There are 3 Steps involved in it

Get step-by-step solutions from verified subject matter experts