

Question: Here is my code: import random import matplotlib.pyplot as plt def simulateDay(numFatalities, numInfected, numRecovered, numSusceptible, numContacts, spreadProb, deathProb, recoverProb): #these two lines calculates the total
Here is my code:
import random import matplotlib.pyplot as plt
def simulateDay(numFatalities, numInfected, numRecovered, numSusceptible, numContacts, spreadProb, deathProb, recoverProb): #these two lines calculates the total number of people and number of infected people. (Also infection rate formula is already given) numPeople = numInfected + numRecovered + numSusceptible infectionRate = (spreadProb * numInfected * numContacts) / numPeople #this function determines the number of susceptible people. for i in range(numSusceptible): rand = random.random() #when the random is smaller than infection rate the susceptible people are infected. #because of the people infected, the number of infected people are increasing 1. #on the other hand, the number of susceptible people are decreasing 1. if rand
return numFatalities, numInfected, numRecovered, numSusceptible
def simulateNDays(numDays, initialInfected, numPeople, numContacts, spreadProb, deathProb, recoverProb): numFatalities = 0 numInfected = initialInfected numRecovered = 0 numSusceptible = numPeople - numInfected
fatalities = [numFatalities] infected = [numInfected] recovered = [numRecovered] susceptible = [numSusceptible] for day in range(numDays): f,i,r,s = simulateDay(numFatalities, numInfected, numRecovered, numSusceptible, numContacts, spreadProb, deathProb, recoverProb)
fatalities.append(f) infected.append(i) recovered.append(r) susceptible.append(s) numFatalities = f numInfected = i numRecovered = r numSusceptible = s return fatalities, infected, recovered, susceptible
numDays = 50 f,i,r,s = simulateNDays(numDays, 1, 100, 30, 0.10, 0.025, 0.15)
plt.legend(['Fatalities','Infected','Recovered','Susceptible'], loc='upper right') plt.xlabel('Day') plt.ylabel('Count') plt.title('Spread of Infection') plt.plot(f, 'sr') plt.plot(i, '^y') plt.plot(r, '.g') plt.plot(s, '+b') plt.show()
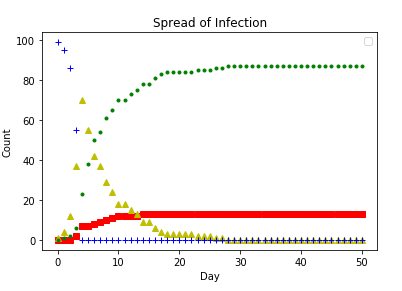
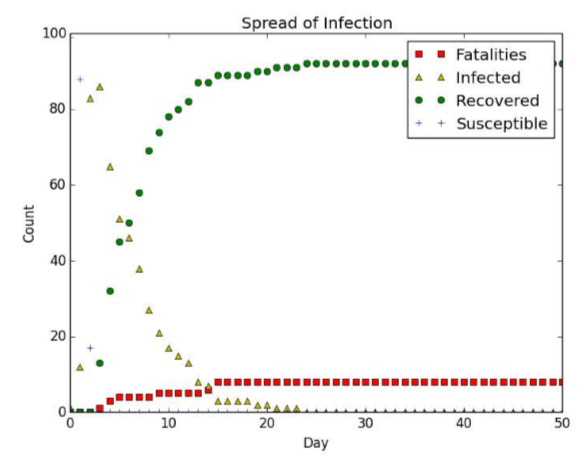
How do I a) get the black border around my points and b) get the legend to even show up like it is in the second picture? This uses python 3.6.
Spread of Infection 1001+ 0 10 20 30 40 50 Day
Step by Step Solution
There are 3 Steps involved in it

Get step-by-step solutions from verified subject matter experts