

Question: Here is the graph from part A. The question is international trade causes the price of the cloth to double while the price of food
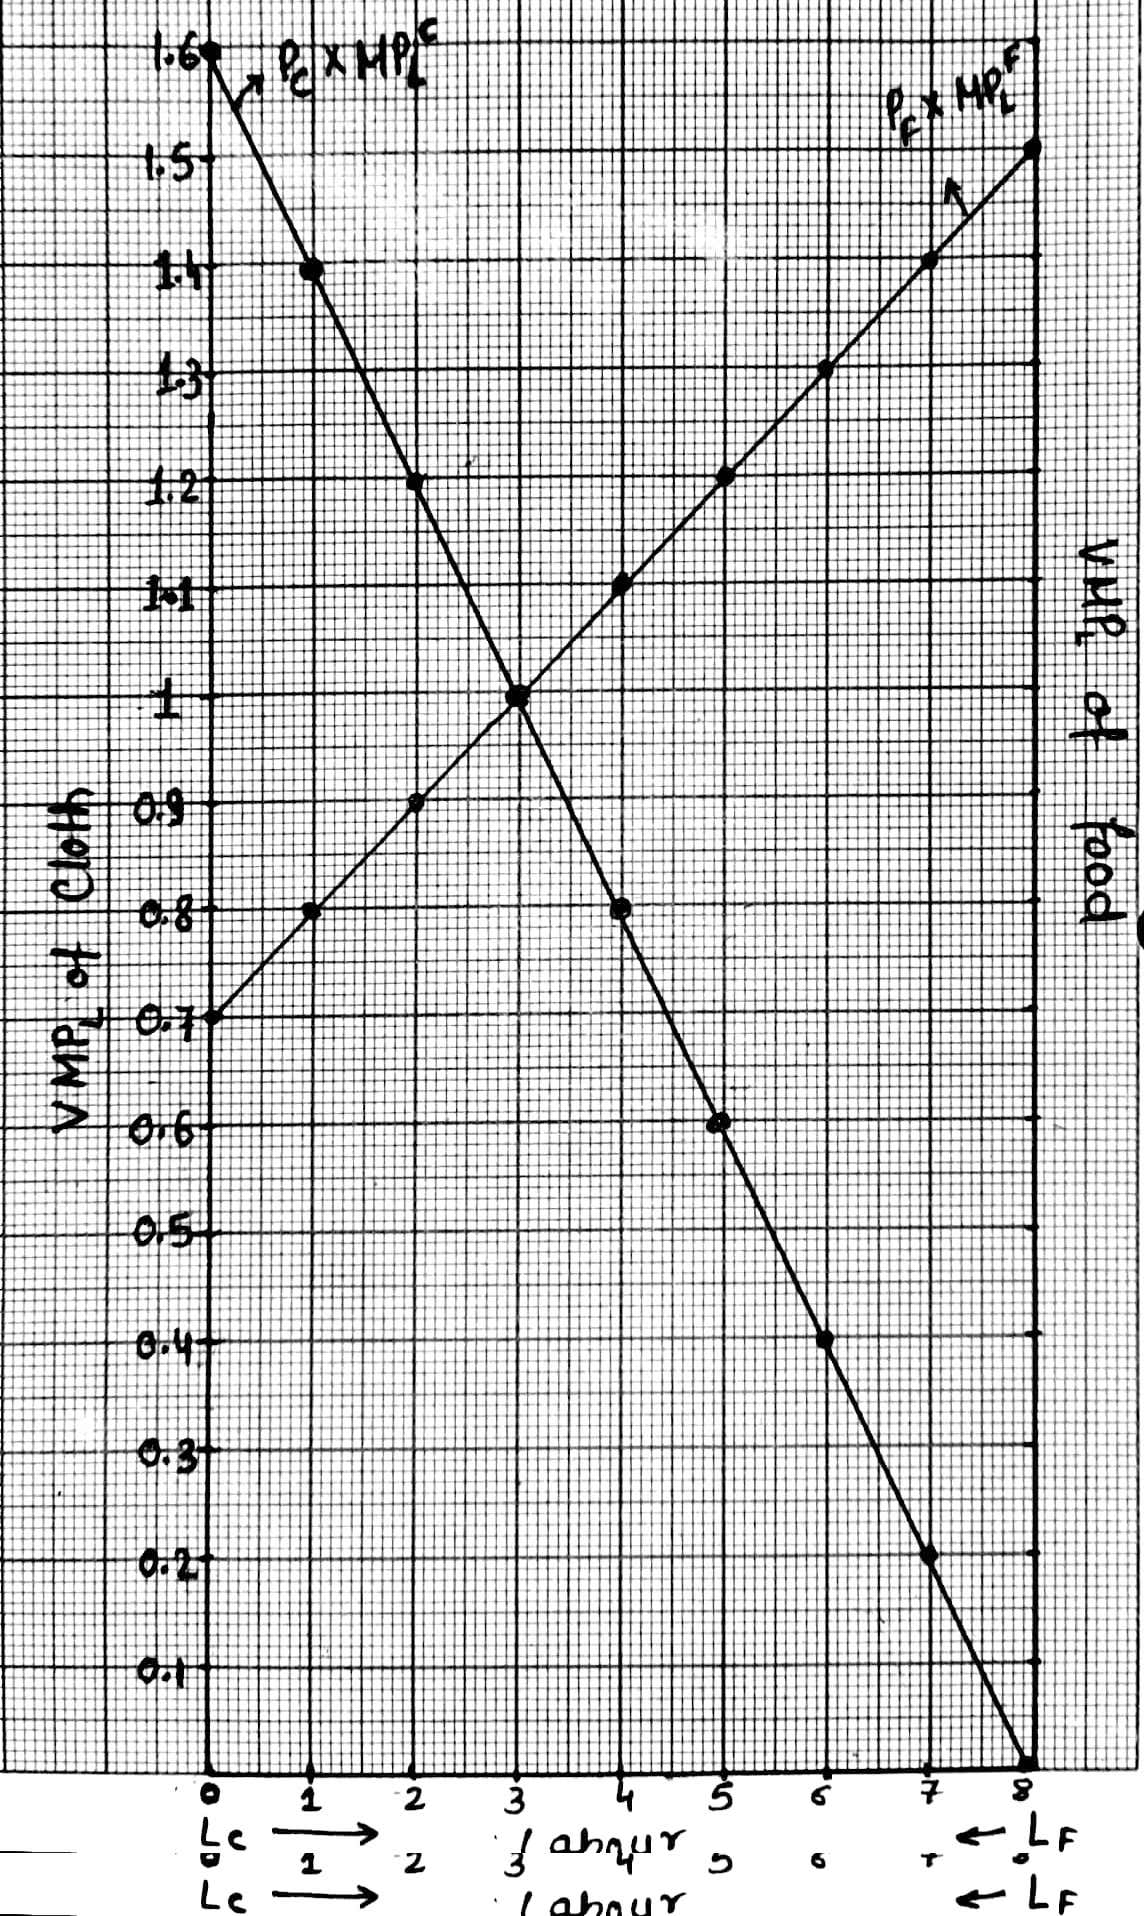

Here is the graph from part A. The question is international trade causes the price of the cloth to double while the price of food stays the same. What would this do to the graph? Draw a new graph to capture this change in the price of cloth.


\fSuppose that international trade causes the price of cloth to double (from 1 to 2), while the price of food remains the same. Show the effect that this will have on your graph in part a. Use
Step by Step Solution
There are 3 Steps involved in it
1 Expert Approved Answer
Step: 1 Unlock

Question Has Been Solved by an Expert!
Get step-by-step solutions from verified subject matter experts
Step: 2 Unlock
Step: 3 Unlock