Question: Here is the Question and the excel spreadsheet to get the data Part 3. Perform risk analyses for the project. (20 marks) Your team has
Here is the Question and the excel spreadsheet to get the data
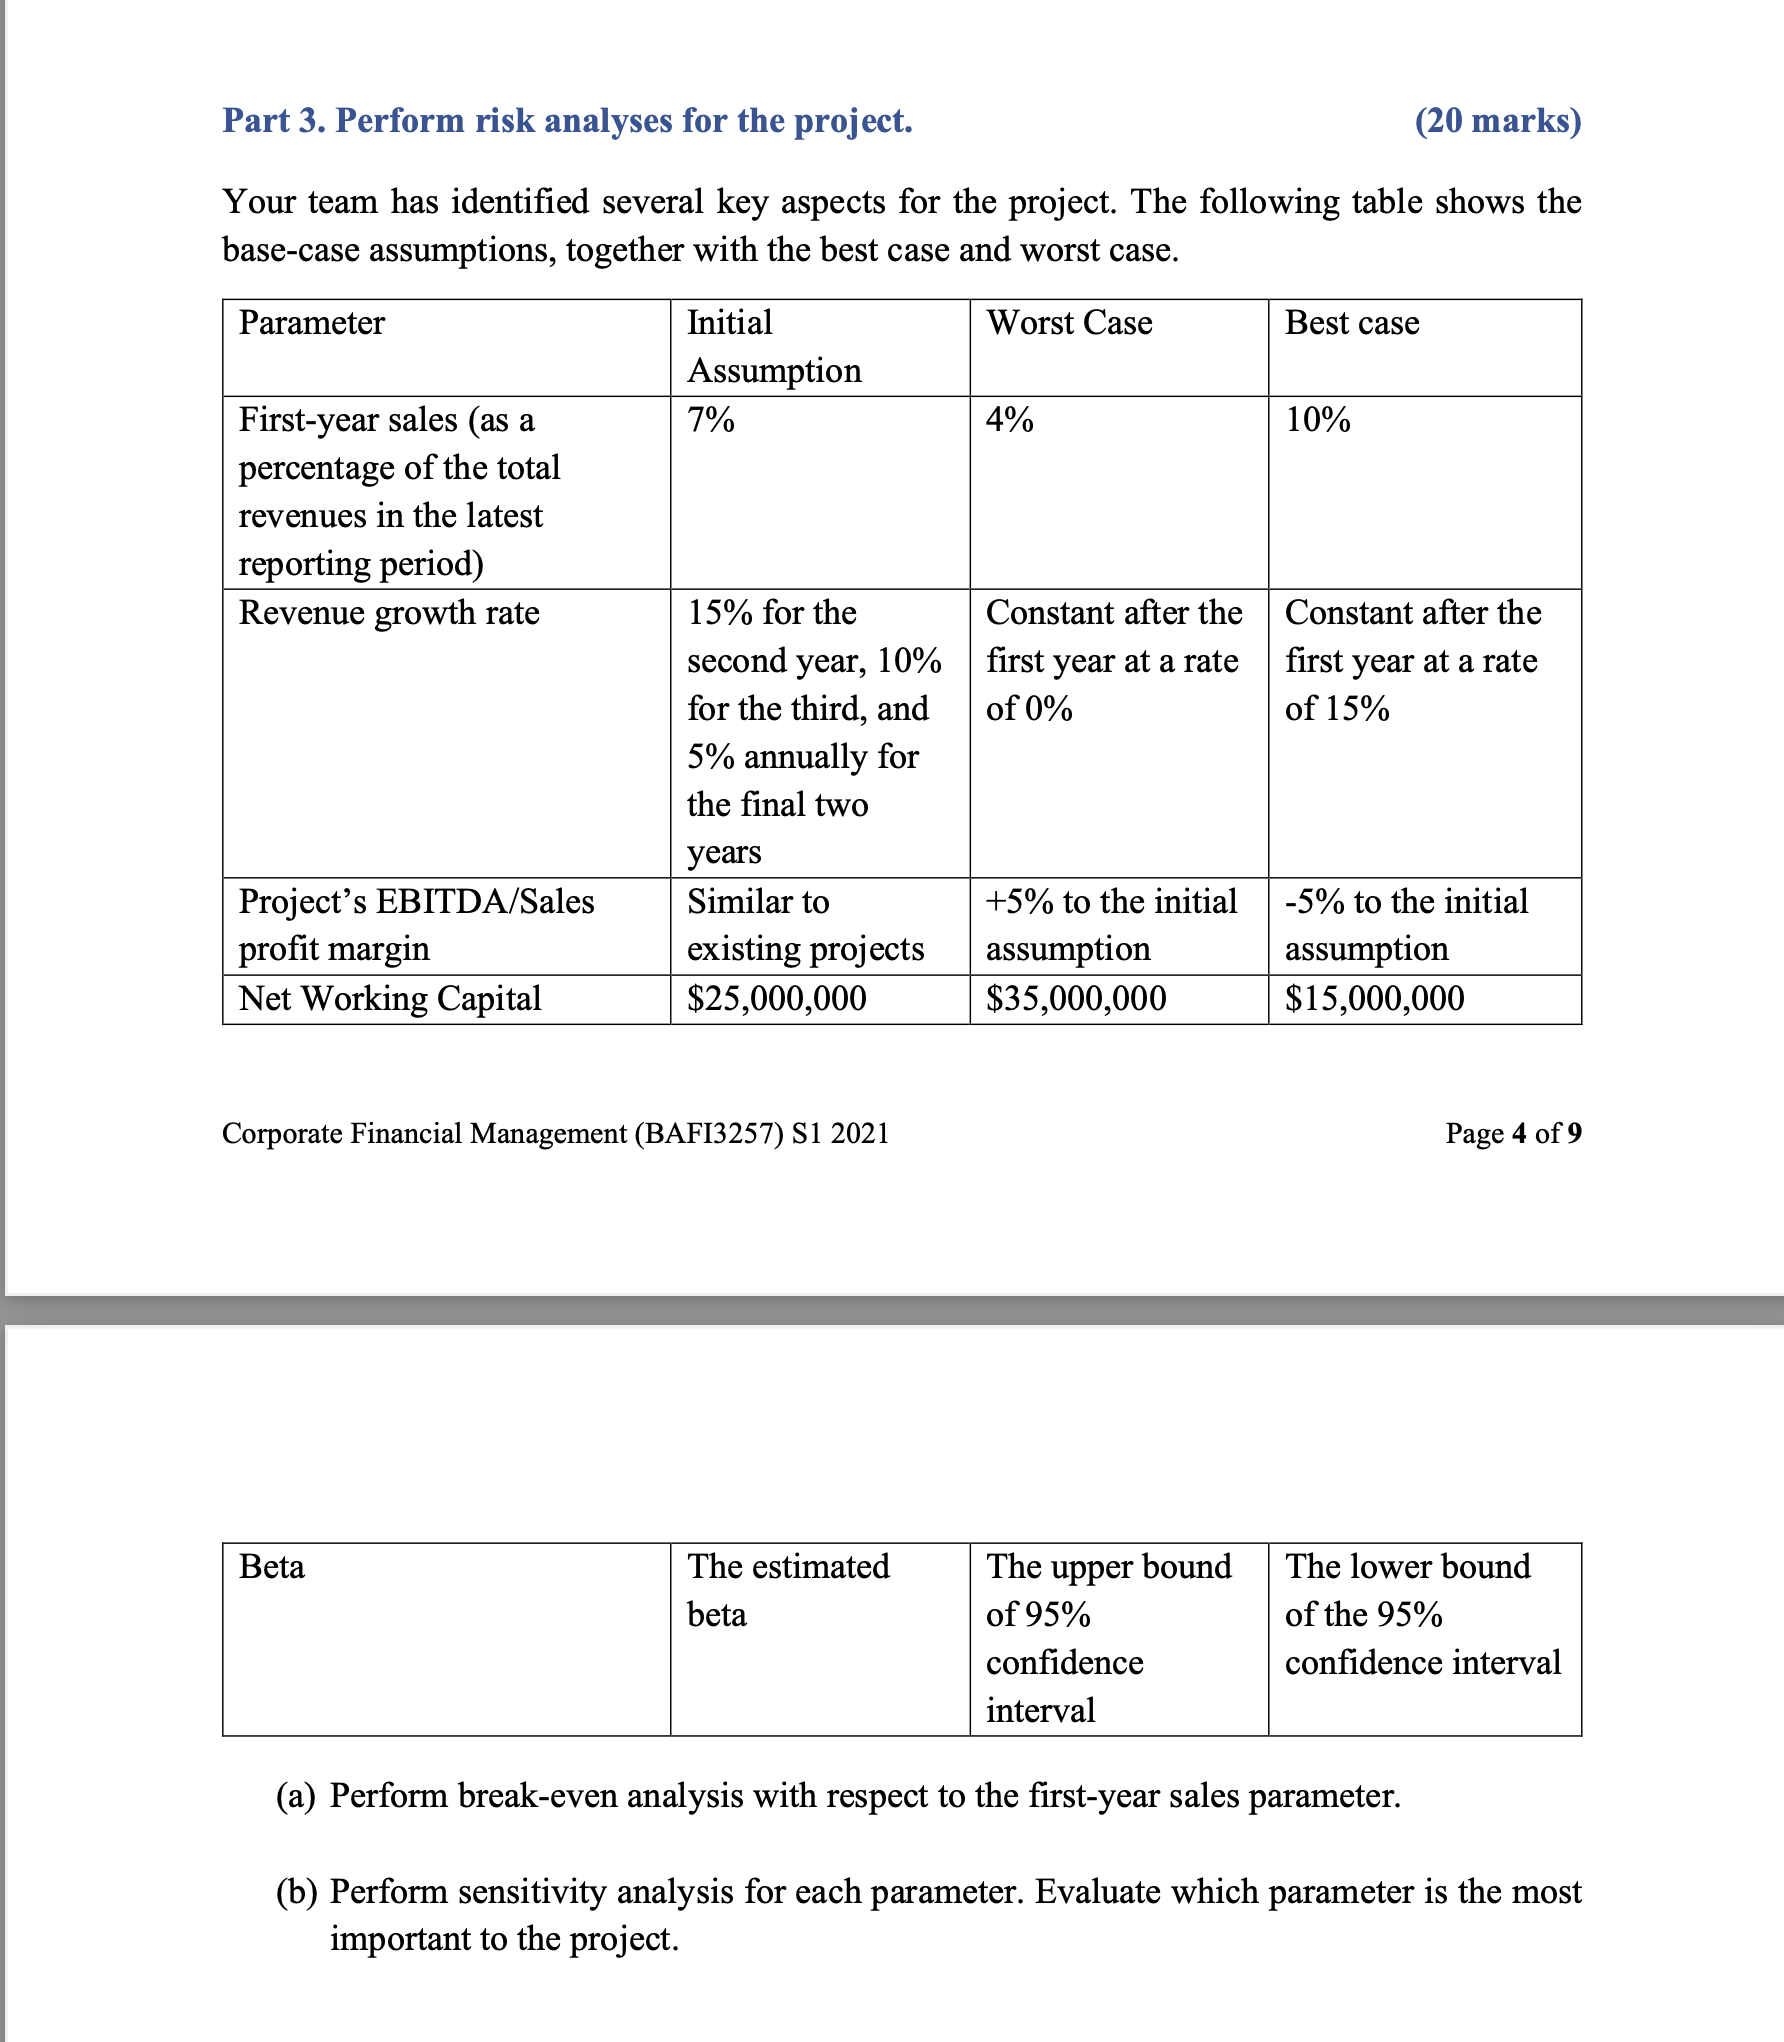
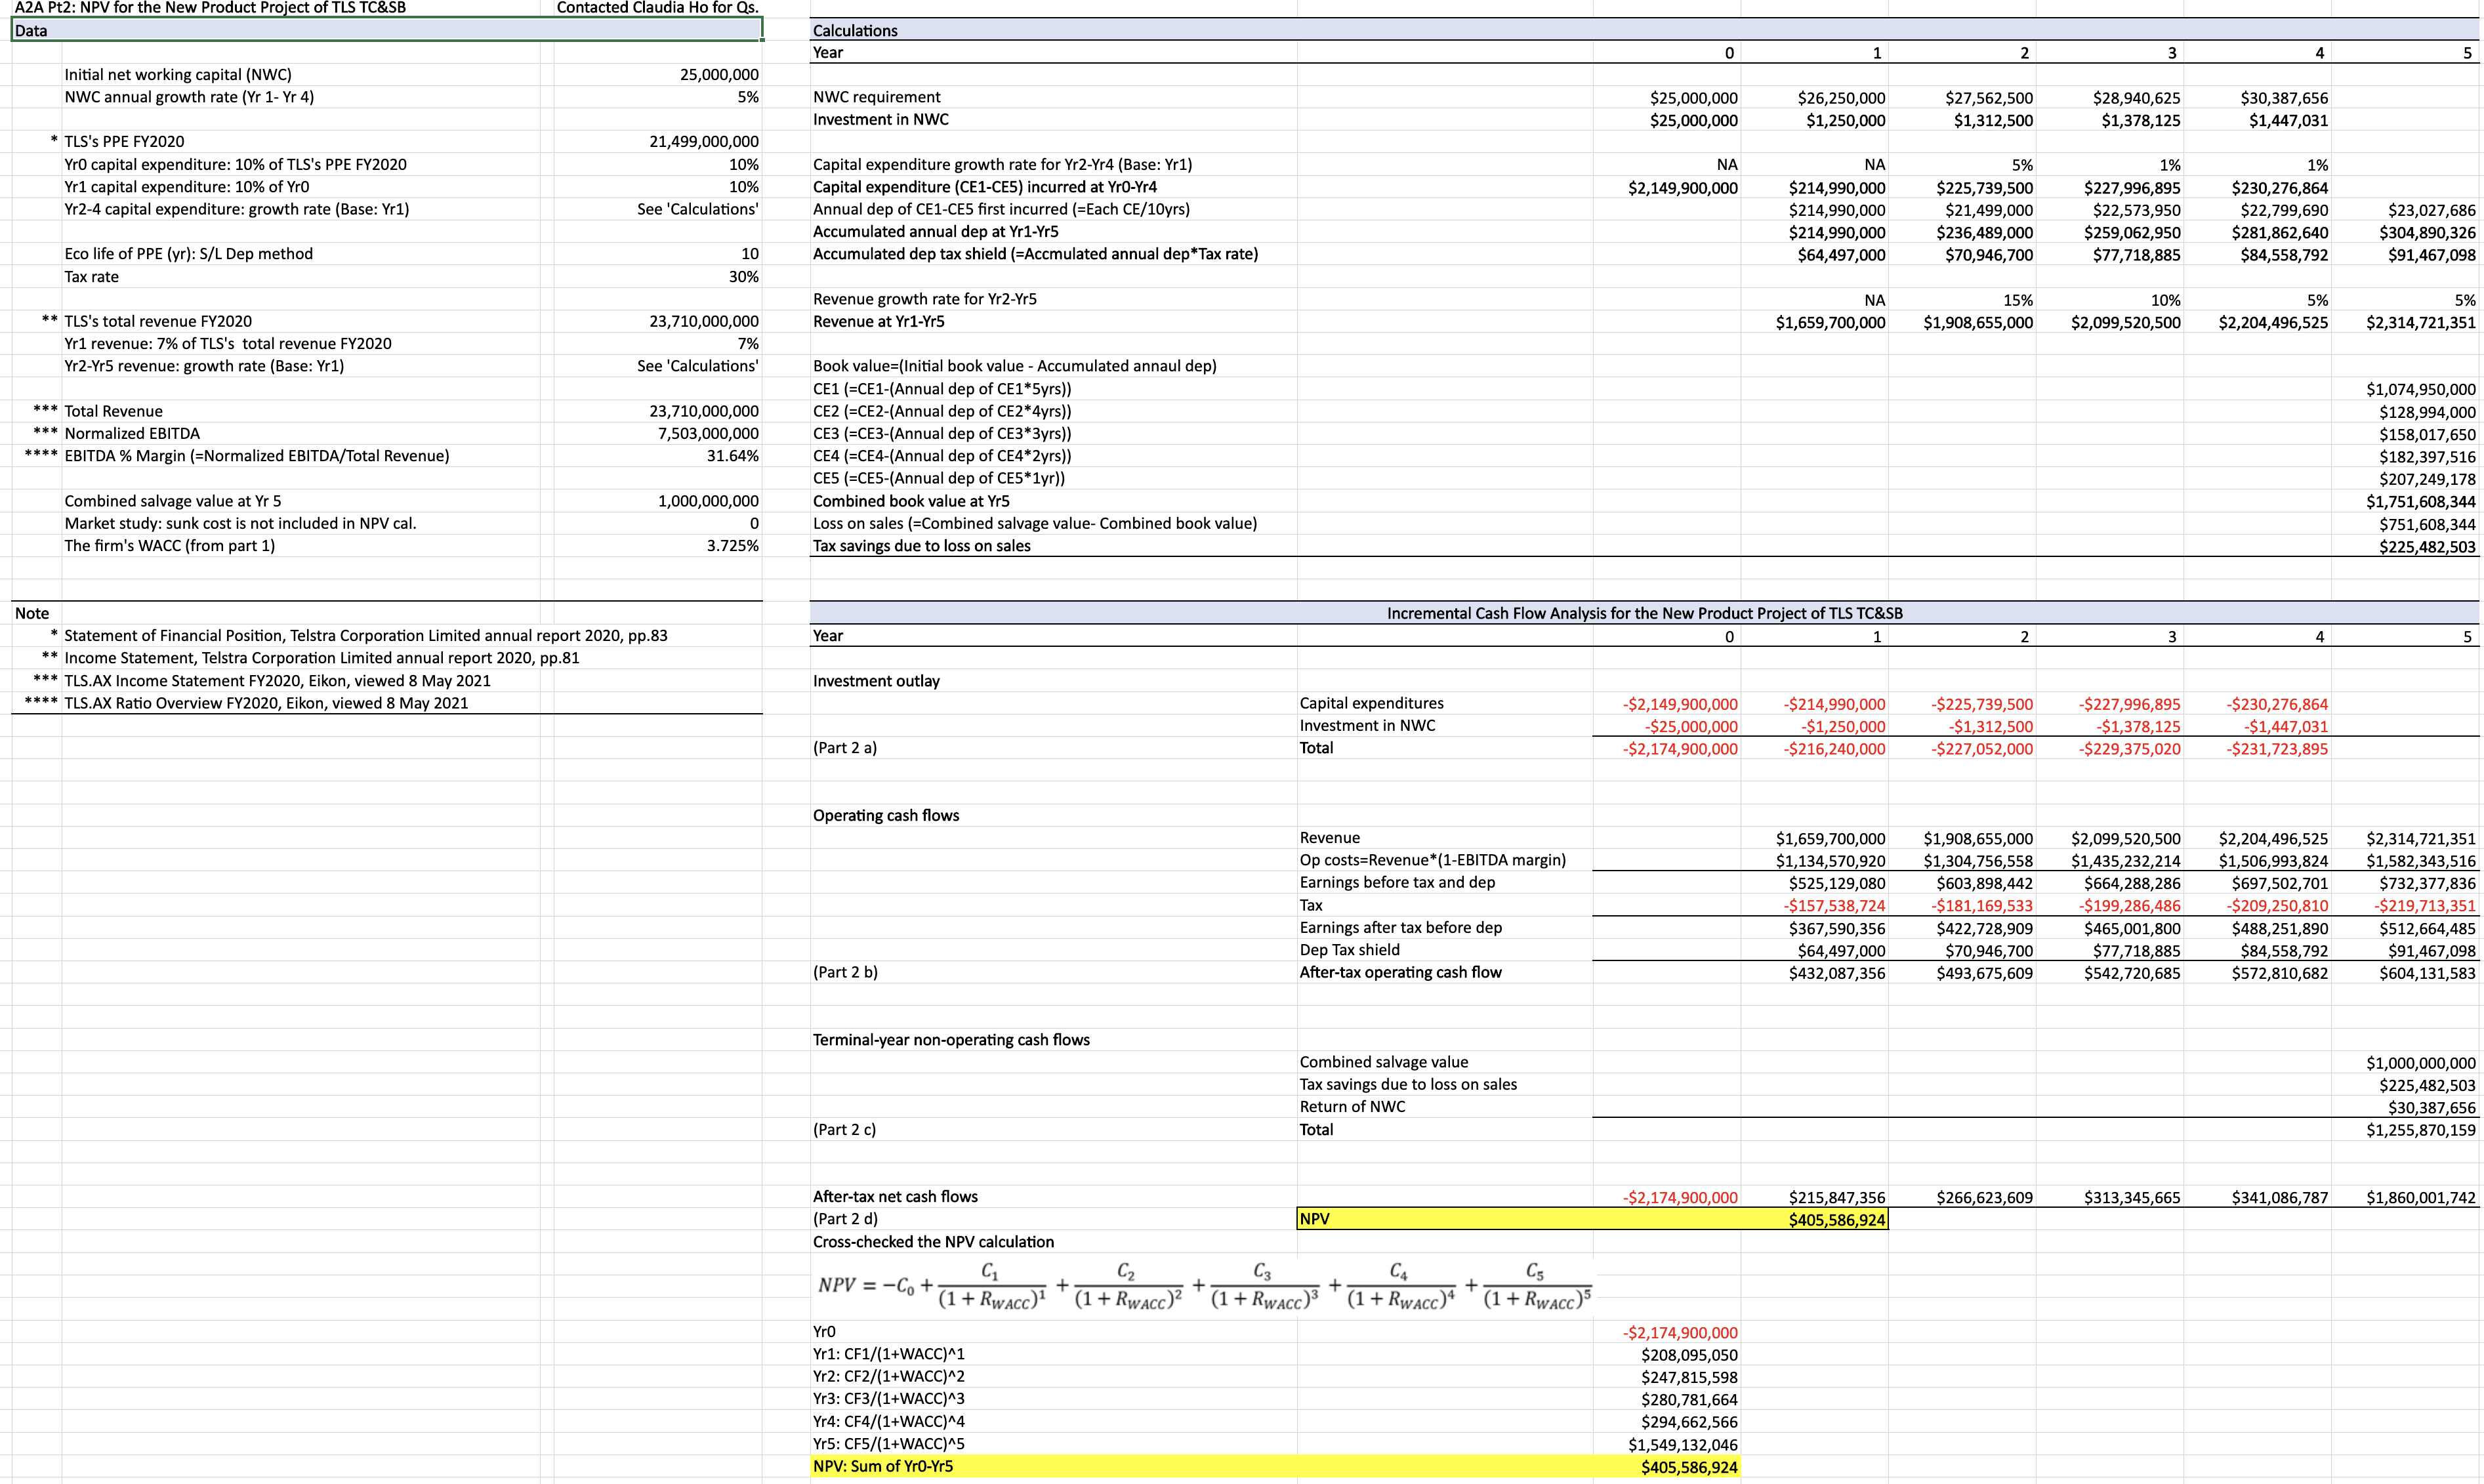
Part 3. Perform risk analyses for the project. (20 marks) Your team has identified several key aspects for the project. The following table shows the base-case assumptions, together with the best case and worst case. Parameter Initial Worst Case Best case Assumption First-year sales (as a 7% 4% 10% percentage of the total revenues in the latest reporting period Revenue growth rate 15% for the Constant after the Constant after the second year, 10% first year at a rate first year at a rate for the third, and of 0% of 15% 5% annually for the final two years Project's EBITDA/Sales Similar to +5% to the initial -5% to the initial profit margin existing projects assumption assumption Net Working Capital $25,000,000 $35,000,000 $15,000,000 Corporate Financial Management (BAFI3257) S1 2021 Page 4 of 9 Beta The estimated The upper bound The lower bound beta of 95% of the 95% confidence confidence interval interval (a) Perform break-even analysis with respect to the first-year sales parameter. (b) Perform sensitivity analysis for each parameter. Evaluate which parameter is the most important to the project.A2A Pt2: NPV for the New Product Project of TLS TC&SB Contacted Claudia Ho for Qs. Data Calculations Year Initial net working capital (NWC) 25,000,000 NWC annual growth rate (Yr 1- Yr 4) 5% NWC requirement $25,000,000 $26,250,000 $27,562,500 $28,940,625 $30,387,656 Investment in NWC $25,000,00 $1,250,000 $1,312,500 $1,378,125 $1,447,031 TLS's PPE FY2020 21,499,000,000 Yro capital expenditure: 10% of TLS's PPE FY2020 10% Capital expenditure growth rate for Yr2-Yr4 (Base: Yr1) NA NA 5% 1% 1% Yr1 capital expenditure: 10% of Yr0 109 Capital expenditure (CE1-CE5) incurred at Yro-Yr4 $2,149,900,000 $214,990,000 $225,739,500 $227,996,895 $230,276,864 Yr2-4 capital expenditure: growth rate (Base: Yr1) See 'Calculations' Annual dep of CE1-CE5 first incurred (=Each CE/10yrs) $214,990,000 $21,499,00 $22,573,950 $22,799,690 $23,027,686 Accumulated annual dep at Yr1-Yr5 $214,990,000 $236,489,00 $259,062,950 $281,862,640 $304,890,326 Eco life of PPE (yr): S/L Dep method 10 Accumulated dep tax shield (=Accmulated annual dep*Tax rate) $64,497,000 $70,946,700 $77,718,885 $84,558,792 $91,467,098 Tax rate 30% Revenue growth rate for Yr2-Yr5 NA 15% 10% 5% 5% ** TLS's total revenue FY2020 23,710,000,000 Revenue at Yr1-Yr5 $1,659,700,000 $1,908,655,000 $2,099,520,500 $2,204,496,525 $2,314,721,351 Yr1 revenue: 7% of TLS's total revenue FY2020 7% Yr2-Yr5 revenue: growth rate (Base: Yr1) See 'Calculations Book value=(Initial book value - Accumulated annaul dep) CE1 (=CE1-(Annual dep of CE1*5yrs)) $1,074,950,000 *** Total Revenue 23,710,000,00 CE2 (=CE2-(Annual dep of CE2*4yrs) $128,994,000 *** Normalized EBITDA 7,503,000,000 CE3 (=CE3-(Annual dep of CE3*3yrs) $158,017,650 **** EBITDA % Margin (=Normalized EBITDA/Total Revenue) 31.64% CE4 (=CE4-(Annual dep of CE4* 2yrs) $182,397,516 CE5 (=CE5-(Annual dep of CE5*1yr)) $207,249,178 Combined salvage value at Yr 5 1,000,000,000 Combined book value at Yr5 $1,751,608,344 Market study: sunk cost is not included in NPV cal. Loss on sales (=Combined salvage value- Combined book value) $751,608,344 The firm's WACC (from part 1) 3.725% Tax savings due to loss on sales $225,482,503 Note Incremental Cash Flow Analysis for the New Product Project of TLS TC&SB * Statement of Financial Position, Telstra Corporation Limited annual report 2020, pp.83 Year o ** Income Statement, Telstra Corporation Limited annual report 2020, pp.81 *** TLS.AX Income Statement FY2020, Eikon, viewed 8 May 2021 Investment outlay **** TLS.AX Ratio Overview FY2020, Eikon, viewed 8 May 2021 Capital expenditures $2,149,900,000 -$214,990,000 -$225,739,500 $227,996,895 $230,276,864 Investment in NWC -$25,000,000 -$1,250,000 -$1,312,50 -$1,378,125 -$1,447,031 (Part 2 a) Total $2,174,900,000 -$216,240,000 -$227,052,000 -$229,375,020 -$231,723,895 Operating cash flows Revenue $1,659,700,000 $1,908,655,000 $2,099,520,500 $2,204,496,525 $2,314,721,351 Op costs=Revenue*(1-EBITDA margin) $1,134,570,920 $1,304,756,558 $1,435,232,214 $1,506,993,824 $1,582,343,516 Earnings before tax and dep $525,129,080 $603,898,442 $664,288,286 $697,502,701 $732,377,836 Tax $157,538,724 $181,169,533 $199,286,486 $209,250,810 $219,713,351 Earnings after tax before dep $367,590,356 422,728,909 $465,001,800 488,251,890 $512,664,485 Dep Tax shield $64,497,000 $70,946,70 $77,718,88 $84,558,792 $91,467,098 (Part 2 b) After-tax operating cash flow $432,087,356 $493,675,609 $542,720,685 $572,810,682 $604,131,583 Terminal-year non-operating cash flows Combined salvage value $1,000,000,000 Tax savings due to loss on sales $225,482,503 Return of NWC $30,387,656 (Part 2 c) Total $1,255,870,159 After-tax net cash flows $2,174,900,000 $215,847,356 $266,623,609 $313,345,665 $341,086,787 $1,860,001,742 (Part 2 d) NPV $405,586,924 Cross-checked the NPV calculation C1 C2 C3 CA C5 NPV = -Co + 7 (1 + RWACC)1 (1 + RWACC)2 (1 + RWACC)3 (1 + RWACC)4 (1 + RWACC)5 Yro -$2,174,900,000 Yr1: CF1/(1+WACC)^1 $208,095,050 Yr2: CF2/(1+WACC)^2 $247,815,598 Yr3: CF3/(1+WACC)^3 $280,781,664 Yr4: CF4/(1+WACC)^4 $294,662,566 Yr5: CF5/(1+WACC)^5 $1,549,132,046 NPV: Sum of Yro-Yr5 $405,586,924