

Question: Hi, can someone help me with this question? StatChapter12: Problem 9 Previous Problem Problem List Next Problem Results for Entered Answer Preview Result -0.7142 -0.7142
Hi, can someone help me with this question?
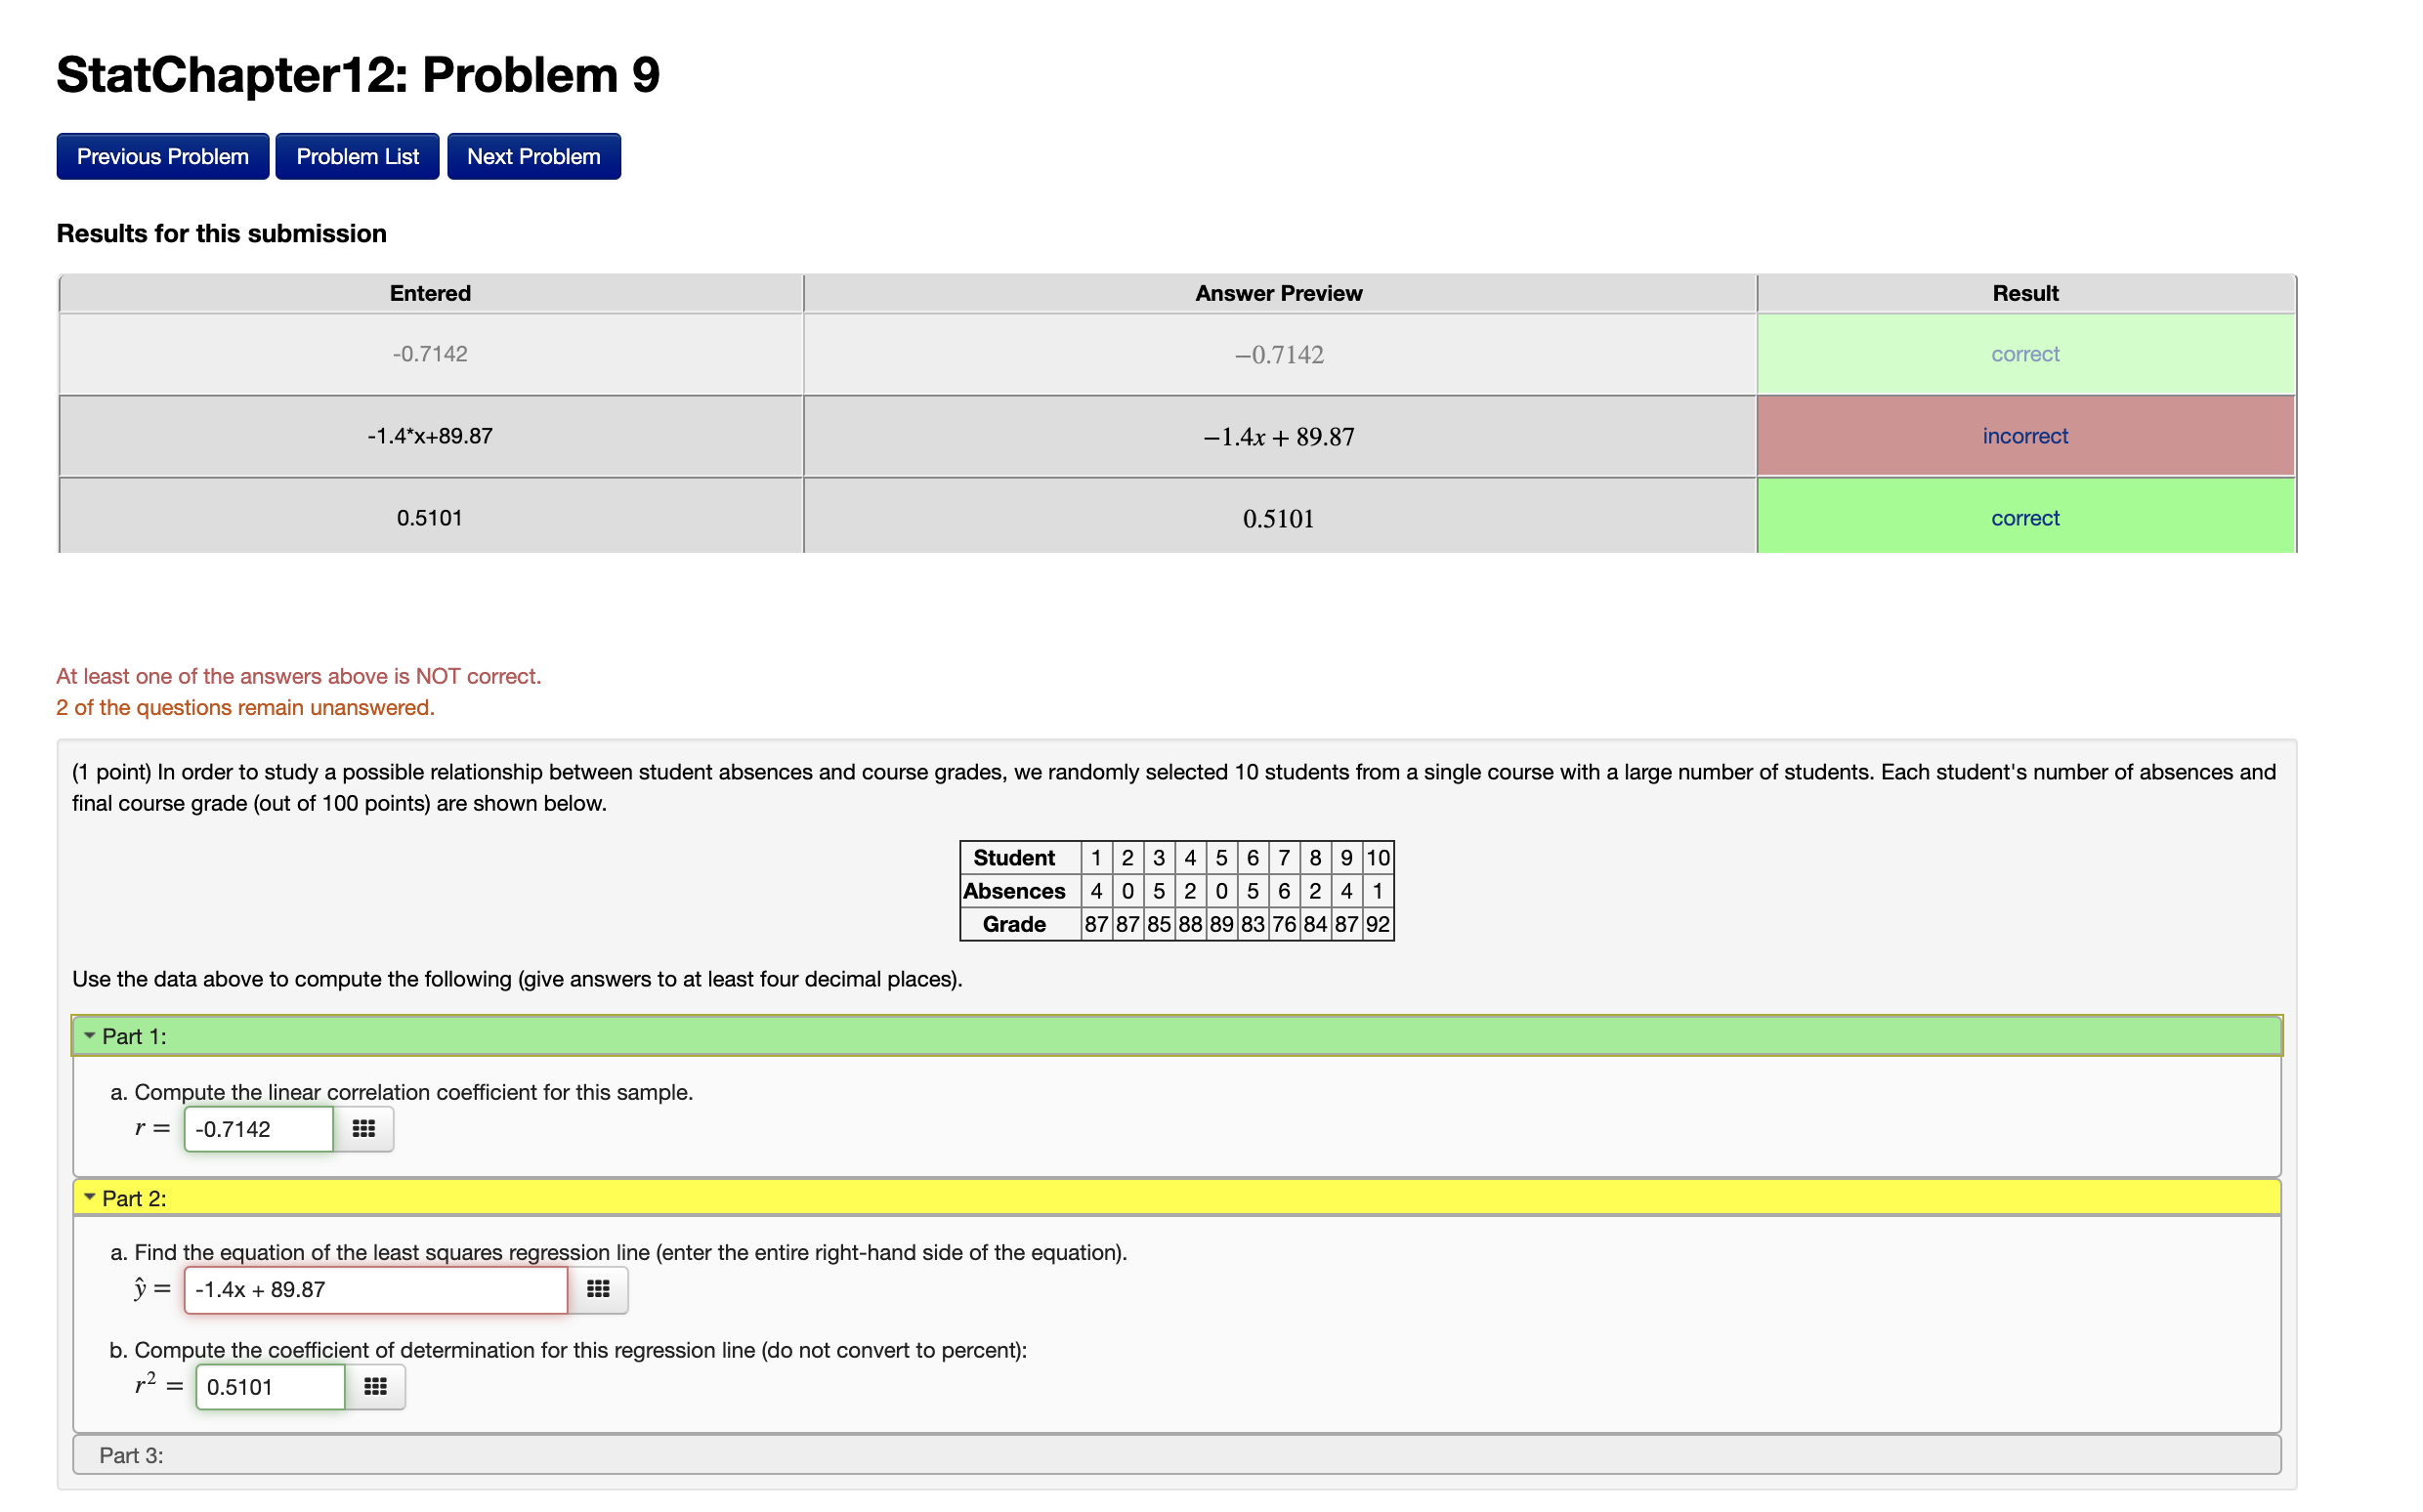
StatChapter12: Problem 9 Previous Problem Problem List Next Problem Results for Entered Answer Preview Result -0.7142 -0.7142 correct -1.4*X+89.87 -1.4x + 89.87 incorrect 0.5101 0.5101 correct At least one of the answers above is NOT correct. 2 of the questions remain unanswered. (1 point) In order to study a possible relationship between student absences and course grades, we randomly selected 10 students from a single course with a large number of students. Each student's number of absences and final course grade (out of 100 points) are shown below. Student 1 2 3 4 5 6 7 8 9 10 Absences 4 0 5 2 0 5 6 2 4 1 Grade 87 87 85 88 89 83 76 84 87 92 Use the data above to compute the following (give answers to at least four decimal places). - Part 1: a. Compute the linear correlation coefficient for this sample. r = -0.7142 - Part 2: a. Find the equation of the least squares regression line (enter the entire right-hand side of the equation). y = -1.4x + 89.87 b. Compute the coefficient of determination for this regression line (do not convert to percent): r2 = 0.5101 Part 3
Step by Step Solution
There are 3 Steps involved in it

Get step-by-step solutions from verified subject matter experts