

Question: hi can you answer this question. I needed help with this. thank you The table below shows the market demand and supply schedules for corn.
hi can you answer this question. I needed help with this. thank you
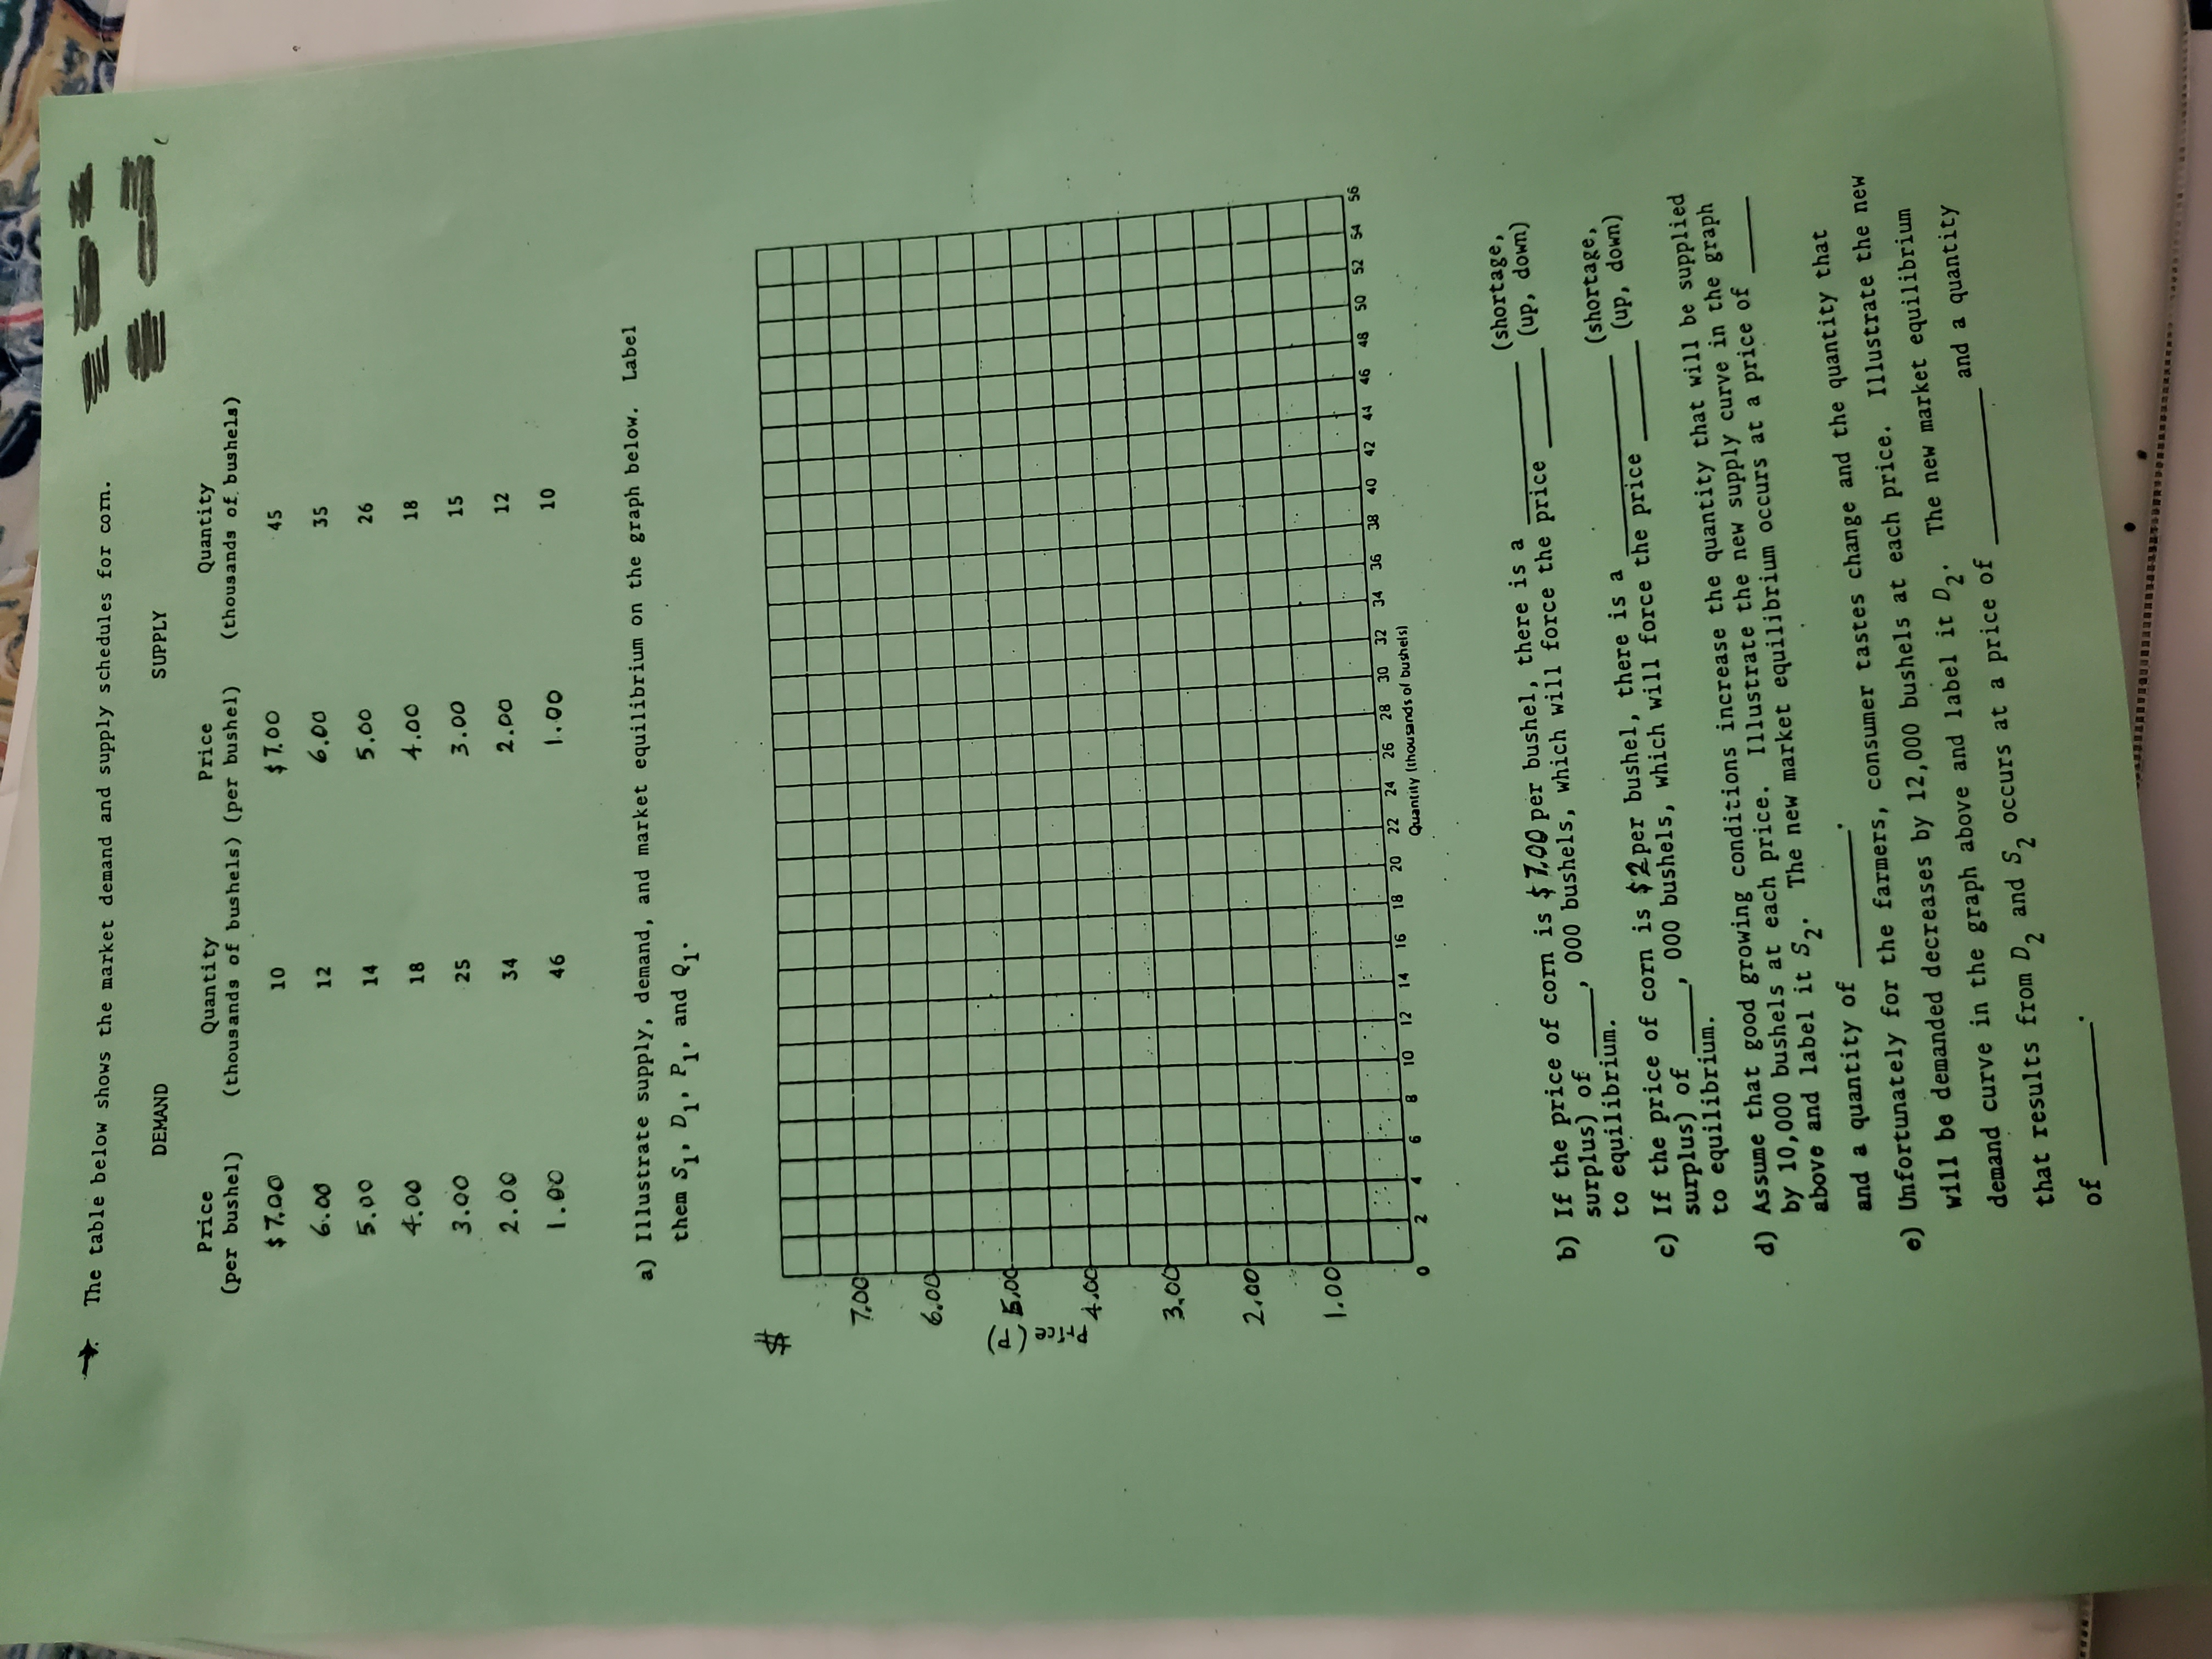
The table below shows the market demand and supply schedules for corn. DEMAND SUPPLY Price (per bushel) Quantity Price (thousands of bushels) (per bushel) Quantity $7.00 ( thousands of bushels) 10 $ 7.00 600 45 12 6.0 5.00 35 14 5.00 4.00 26 18 4.00 18 3.00 25 3.00 15 2.00 34 2.00 12 1. 00 46 1.00 10 a) Illustrate supply, demand, and market equilibrium on the graph below. Label them S1, D1 . P1 . and 91. 7,00 6,00 Price ( P) 3,00 2100 1.00/ 22 24 26 28 30 32 34 36 Quantity (thousands of bushels) b) If the price of corn is $ 7.00 per bushel, there is a (shortage, surplus) of 000 bushels, which will force the price (up, down) to equilibrium. c) If the price of corn is $2per bushel, there is a (shortage, surplus) of , 000 bushels, which will force the price (up, down) to equilibrium. d) Assume that good growing conditions increase the quantity that will be supplied by 10,000 bushels at each price. Illustrate the new supply curve in the graph above and label it S,. The new market equilibrium occurs at a price of and a quantity of e) Unfortunately for the farmers, consumer tastes change and the quantity that will be demanded decreases by 12,000 bushels at each price. Illustrate the new demand curve in the graph above and label it D,. The new market equilibrium and a quantity that results from D, and S, occurs at a price of of
Step by Step Solution
There are 3 Steps involved in it

Get step-by-step solutions from verified subject matter experts