

Question: Hi, Can you help me with this code and explanation by using R studio? Thanks! Problem 2: A normal approximation of the sampling distribution of
Hi, Can you help me with this code and explanation by using R studio? Thanks!
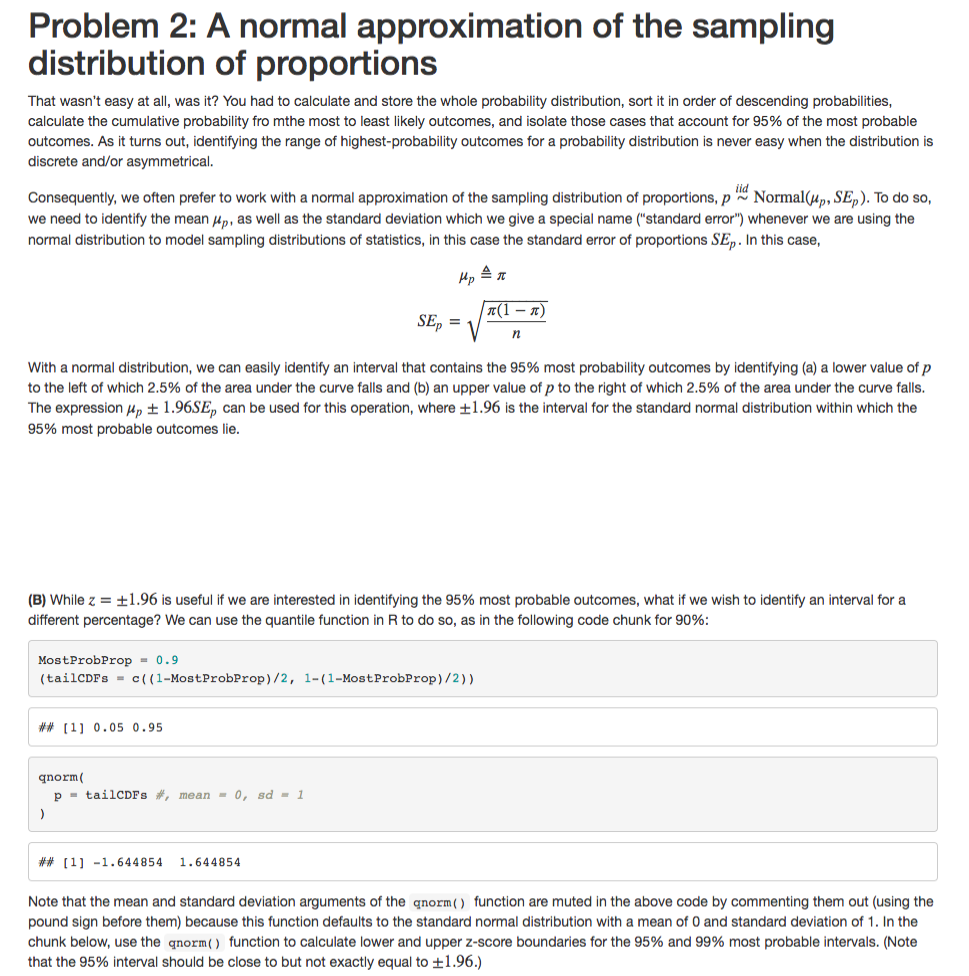
Problem 2: A normal approximation of the sampling distribution of proportions That wasn't easy at all. was It\"?1 You had to calculate and store the whole probability distribution. sort it in order of descending probabilities. calculate the cumulative probability fro mthe most to least likely outcomes, and isolate those cases that account for 95% of the most probable outcomes. As it turns ouL identifying the range of highest-probability outcomes for a probability distribution Is never easy when the distribution is discrete andfor asymmetrical. Consequently. we often prefsrto work with a normal approximation 01' the sampling distribution of proportions. 31 its. Nomlalup. SE\"). To do so. we need to identity:r the mean an, as well as the standard deviation which we give a special name ("standard error'j whenever we are using the normal distribution to model sampling distributions of statistics, in this case the standard error of proportions SEp. In this case. a 3.0:\" taug With a normal distribution, we can easily identify an Interval that contains the 95% most probability outcomes by identliying {a} a lower value or p to the left of which 2.5% of the area under the curve falls and to] an upper value of p to the right of which 2.5% of the area under the curve falls. The expression a, t 1.96353, can be used forthis operation. where 11.96 is the interval forthe standard normal distribution within which the 95% most probable outcomes Ile. [B] While z = $1.96 is useful If we are Interested in Identifying the 95% most probable Outcomes. what if we wish to identify an interval for a different percentage? We can use the quantile function in H to do so. as in the followlng code chunk for 90%: HostProhPrnp - U . 9 [tailCDFs - a: ( l-HoetProhProp] f2, 1-[1-HoatProbPropi-i'213 #11] 0.05 0.95 qbormt p - tailCDFB :i', mean - 0, so' - l i it'dI [1] -1.644354 1.644354. Note that the mean and standard deviation arguments of the quota: l function are muted In the above code by commenting them out (using the pound sign before them} because this function defaults to the standard normal distribution with a mean 01' D and standard deviation of 'i. In the chunk below. use the quorum\" function to calculate lower and upper z-sccre boundaries for the 95% and 99% most probable intervals. {Note that the 95% interval should be close to but not exactly equal to 11.96.]
Step by Step Solution
There are 3 Steps involved in it

Get step-by-step solutions from verified subject matter experts