

Question: Hi expert please answer complete part will do like immediately. Thank you Part III. Diagrams and Matrices 1. A process is in one of three

Hi expert please answer complete part will do like immediately. Thank you
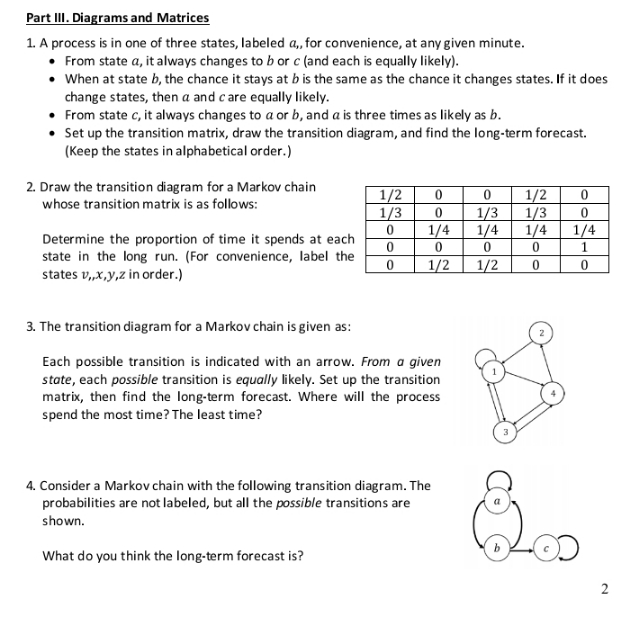
Part III. Diagrams and Matrices 1. A process is in one of three states, labeled a,, for convenience, at any given minute. . From state a, it always changes to b or c (and each is equally likely). . When at state b, the chance it stays at b is the same as the chance it changes states. If it does change states, then a and care equally likely. . From state c, it always changes to a or b, and a is three times as likely as b. . Set up the transition matrix, draw the transition diagram, and find the long-term forecast. (Keep the states in alphabetical order.) 2. Draw the transition diagram for a Markov chain 1/2 0 0 1/2 0 whose transition matrix is as follows: 1/3 0 1/3 1/3 0 0 1/4 1/4 1/4 1/4 Determine the proportion of time it spends at each 0 0 0 0 1 state in the long run. (For convenience, label the 0 1/2 1/2 0 0 states v,,x,y,z in order.) 3. The transition diagram for a Markov chain is given as: Each possible transition is indicated with an arrow. From a given state, each possible transition is equally likely. Set up the transition matrix, then find the long-term forecast. Where will the process spend the most time? The least time? 4. Consider a Markov chain with the following transition diagram. The probabilities are not labeled, but all the possible transitions are shown. What do you think the long-term forecast is? 2
Step by Step Solution
There are 3 Steps involved in it

Get step-by-step solutions from verified subject matter experts