

Question: Using Excel can help with this one! Thanks! Intro The return statistics for two stocks and the risk-free asset, Treasury bills, are given below: A
Using Excel can help with this one! Thanks!
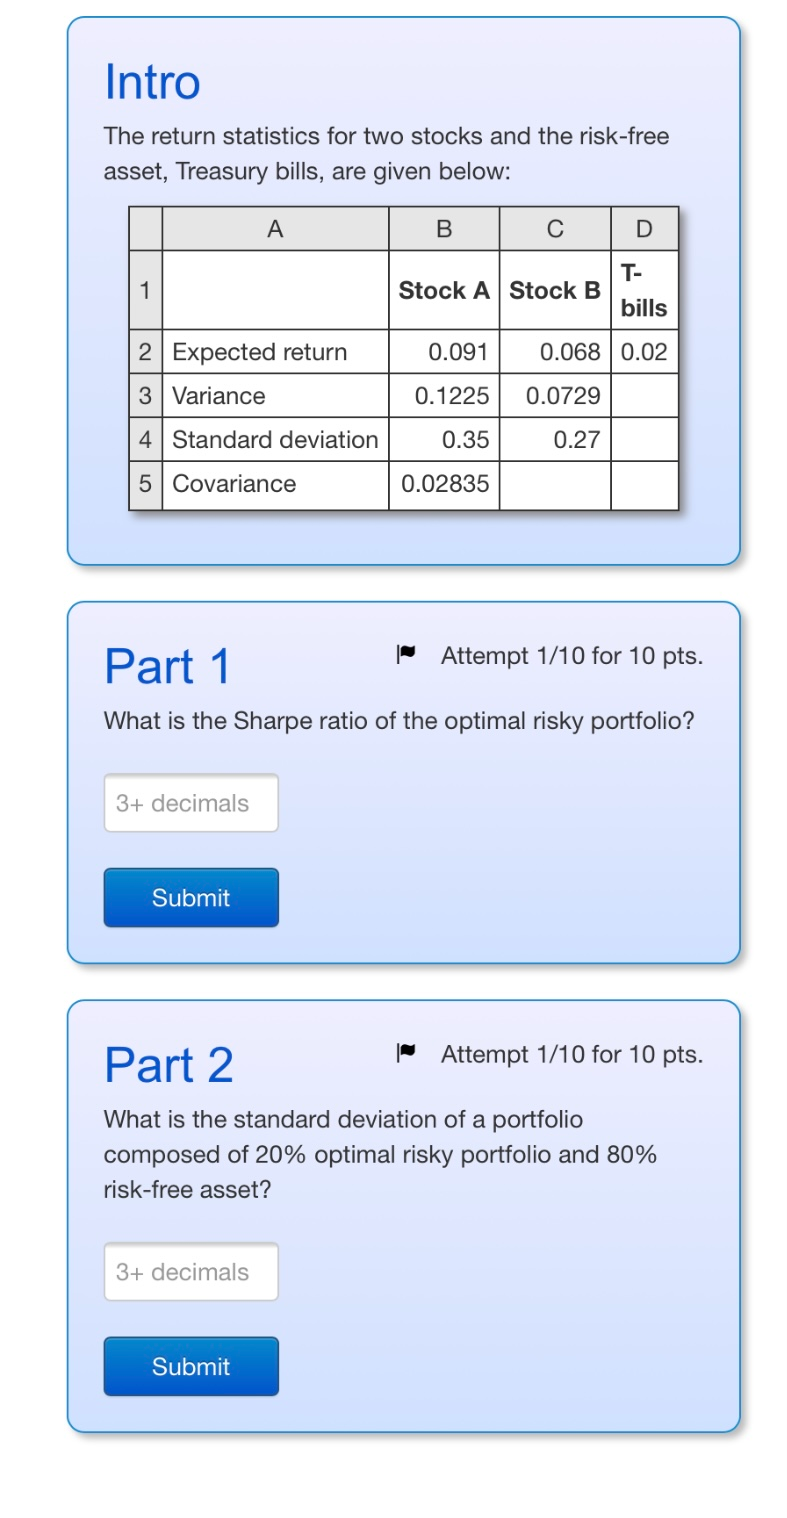
Intro The return statistics for two stocks and the risk-free asset, Treasury bills, are given below: A B D 1 Stock A Stock B T- bills 0.091 0.068 0.02 2 Expected return 3 Variance 0.1225 0.0729 4 Standard deviation 0.35 0.27 5 Covariance 0.02835 Part 1 |Attempt 1/10 for 10 pts. What is the Sharpe ratio of the optimal risky portfolio? 3+ decimals Submit Part 2 | Attempt 1/10 for 10 pts. What is the standard deviation of a portfolio composed of 20% optimal risky portfolio and 80% risk-free asset? 3+ decimals Submit
Step by Step Solution
There are 3 Steps involved in it
1 Expert Approved Answer
Step: 1 Unlock

Question Has Been Solved by an Expert!
Get step-by-step solutions from verified subject matter experts
Step: 2 Unlock
Step: 3 Unlock