

Question: Hi, I'm having difficulty figuring out the ROP units and Number of orders per year that'll need to be made for each region (last two
Hi,
I'm having difficulty figuring out the ROP units and Number of orders per year that'll need to be made for each region (last two columns). I don't think my calculations are correct; please help.
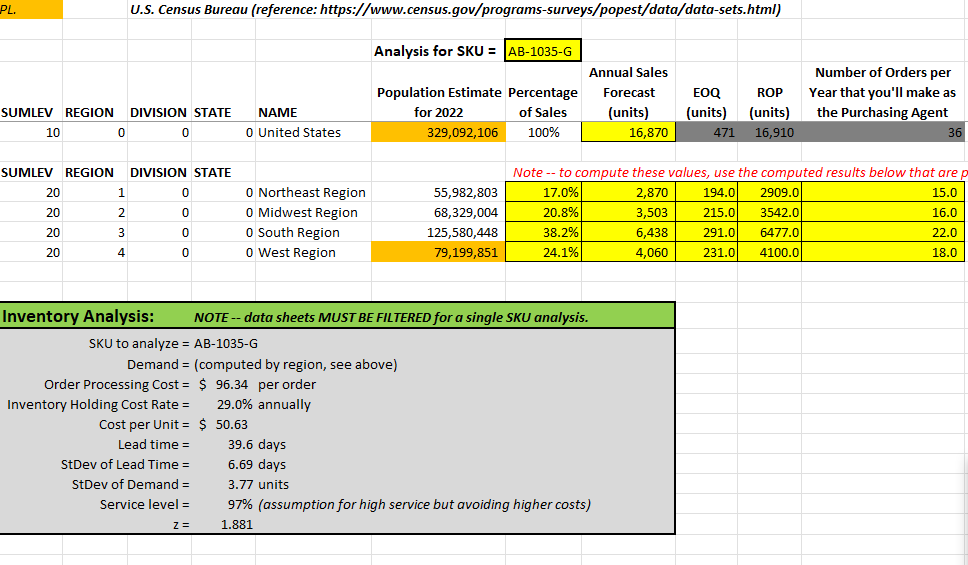
PL. U.S. Census Bureau (reference: https://www.census.gov/programs-surveys/popest/data/data-sets.html) Analysis for SKU = AB-1035-G Annual Sales Number of Orders per Population Estimate Percentage Forecast EOQ ROP Year that you'll make as SUMLEV REGION DIVISION STATE NAME for 2022 of Sales (units) (units) (units) the Purchasing Agent 10 0 0 0 United States 329,092,106 100% 16,870 471 16,910 36 SUMLEV REGION DIVISION STATE Note -- to compute these values, use the computed results below that are p 20 1 0 0 Northeast Region 55,982,803 17.0% 2,870 194.0 2909.0 15.0 20 0 0 Midwest Region 68,329,004 20.8% 3,503 215.0 3542.0 16.0 20 O 0 South Region 125,580,448 38.2% 6,438 291.0 6477.0 22.0 20 4 0 0 West Region 79,199,851 24.1% 4,060 231.0 4100.0 18.0 Inventory Analysis: NOTE -- data sheets MUST BE FILTERED for a single SKU analysis. SKU to analyze = AB-1035-G Demand = (computed by region, see above) Order Processing Cost = $ 96.34 per order Inventory Holding Cost Rate = 29.0% annually Cost per Unit = $ 50.63 Lead time = 39.6 days StDev of Lead Time = 6.69 days StDev of Demand = 3.77 units Service level = 97% (assumption for high service but avoiding higher costs) Z= 1.881
Step by Step Solution
There are 3 Steps involved in it

Get step-by-step solutions from verified subject matter experts