

Question: hi please help me with this thanks Topic Coverage: Statistical Process Control/ Control Chart for Variables and Attributes 1. Examine the Statistical Process Control outputs
hi please help me with this thanks
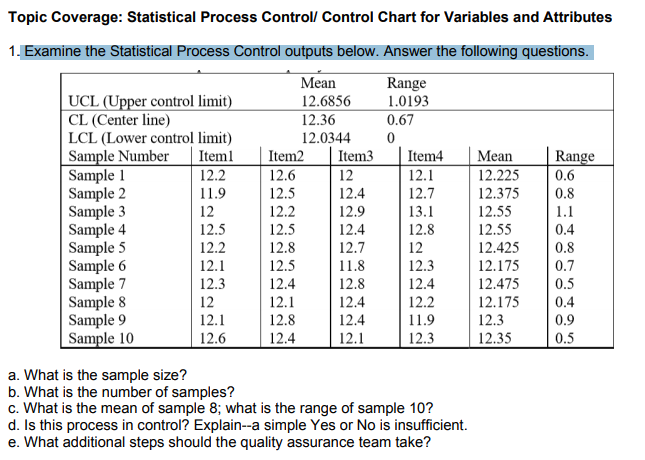
Topic Coverage: Statistical Process Control/ Control Chart for Variables and Attributes 1. Examine the Statistical Process Control outputs below. Answer the following questions. Mean Range UCL (Upper control limit) 12.6856 1.0193 CL (Center line) 12.36 0.67 LCL (Lower control limit) 12.0344 0 Sample Number Iteml Item2 Item3 Item4 Mean Range Sample 1 12.2 12.6 12 12.1 12.225 0.6 Sample 2 11.9 12.5 12.4 12.7 12.375 0.8 Sample 3 12 12.2 12.9 13.1 12.55 1.1 Sample 4 12.5 12.5 12.4 12.8 12.55 0.4 Sample 5 12.2 12.8 12.7 12 12.425 0.8 Sample 6 12.1 12.5 11.8 12.3 12.175 0.7 Sample 7 12.3 12.4 12.8 12.4 12.475 0.5 Sample 8 12 12.1 12.4 12.2 12.175 0.4 Sample 9 12.1 12.8 12.4 11.9 12.3 0.9 Sample 10 12.6 12.4 12.1 12.3 12.35 0.5 a. What is the sample size? b. What is the number of samples? c. What is the mean of sample 8; what is the range of sample 10? d. Is this process in control? Explain--a simple Yes or No is insufficient. e. What additional steps should the quality assurance team take
Step by Step Solution
There are 3 Steps involved in it

Get step-by-step solutions from verified subject matter experts