

Question: hi Please I need the solution in 25minutes Note: Answer all Questions & Assume all required data & figures when it is required. Q1) The
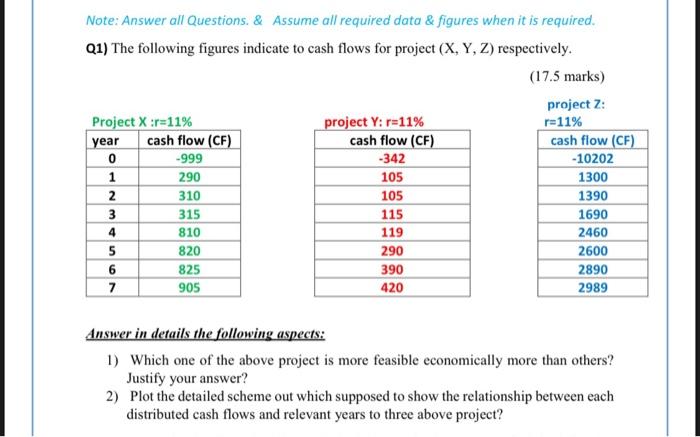
Note: Answer all Questions & Assume all required data & figures when it is required. Q1) The following figures indicate to cash flows for project (X, Y, Z) respectively. (17.5 marks) project : Project X :r=11% project Y: r=11% r=11% year cash flow (CF) cash flow (CF) cash flow (CF) 0 -999 -342 -10202 1 105 1300 2 310 105 1390 3 315 115 1690 119 2460 820 290 2600 6 825 390 2890 7 905 420 2989 290 4 810 NMN 5 Answer in details the following aspects: 1) Which one of the above project is more feasible economically more than others? Justify your answer? 2) Plot the detailed scheme out which supposed to show the relationship between each distributed cash flows and relevant years to three above project
Step by Step Solution
There are 3 Steps involved in it

Get step-by-step solutions from verified subject matter experts