

Question: High Temperature, March 12 - 21, 2017 58 60 62 64 66 68 70 72 76 Temperature (F) This graph has the exact interval spacing
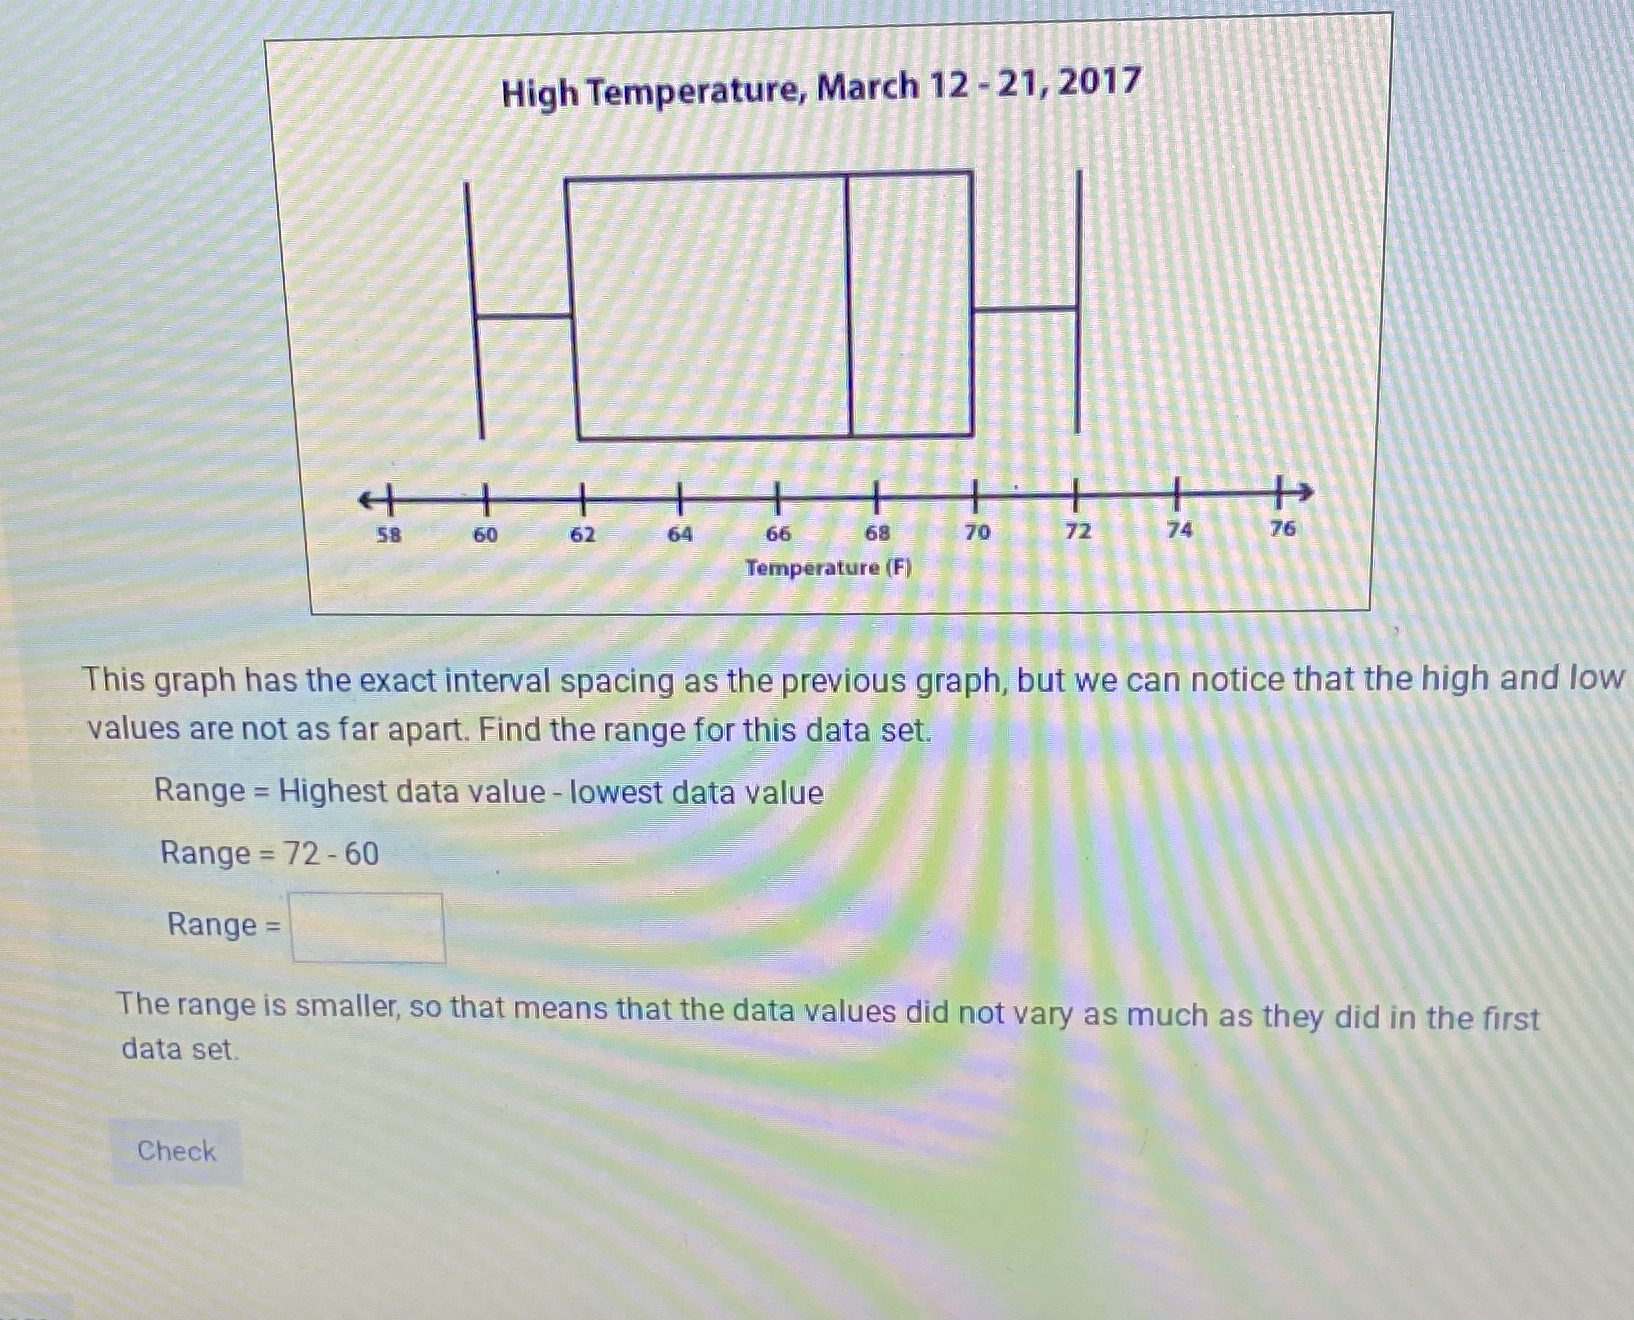
High Temperature, March 12 - 21, 2017 58 60 62 64 66 68 70 72 76 Temperature (F) This graph has the exact interval spacing as the previous graph, but we can notice that the high and low values are not as far apart. Find the range for this data set. Range = Highest data value - lowest data value Range = 72 -60 Range = The range is smaller, so that means that the data values did not vary as much as they did in the first data set. Check
Step by Step Solution
There are 3 Steps involved in it
1 Expert Approved Answer
Step: 1 Unlock

Question Has Been Solved by an Expert!
Get step-by-step solutions from verified subject matter experts
Step: 2 Unlock
Step: 3 Unlock