

Question: Histogram Modification Problems Q1) Figure Q1 shows a 6-level, 7x6 image. 0 1 1 1 0 1 0 3 1 2 2 0 0 3
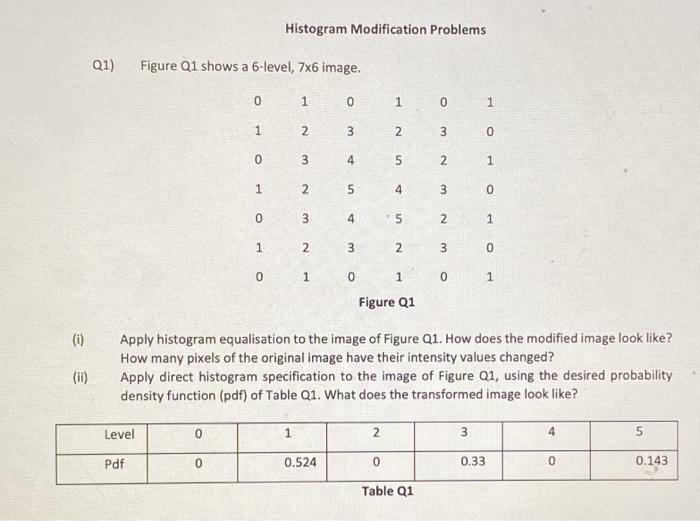
Histogram Modification Problems Q1) Figure Q1 shows a 6-level, 7x6 image. 0 1 1 1 0 1 0 3 1 2 2 0 0 3 4 3 2 3 S 4 1 1 2 5 0 0 3 4 5 N 1 1 2 3 2 3 0 0 1 0 1 0 1 Figure Q1 (i) Apply histogram equalisation to the image of Figure Q1. How does the modified image look like? How many pixels of the original image have their intensity values changed? Apply direct histogram specification to the image of Figure Q1, using the desired probability density function (pdf) of Table Q1. What does the transformed image look like? (ii) Level 0 1 2 3 4 5 Pdf 0 0.524 0 0.33 0 0.143 Table 1
Step by Step Solution
There are 3 Steps involved in it
1 Expert Approved Answer
Step: 1 Unlock

Question Has Been Solved by an Expert!
Get step-by-step solutions from verified subject matter experts
Step: 2 Unlock
Step: 3 Unlock