

Question: Historical data on asset classes tend to show: This is the chart of the Japanese market based on the Nikkei 225 largest firms, which shows
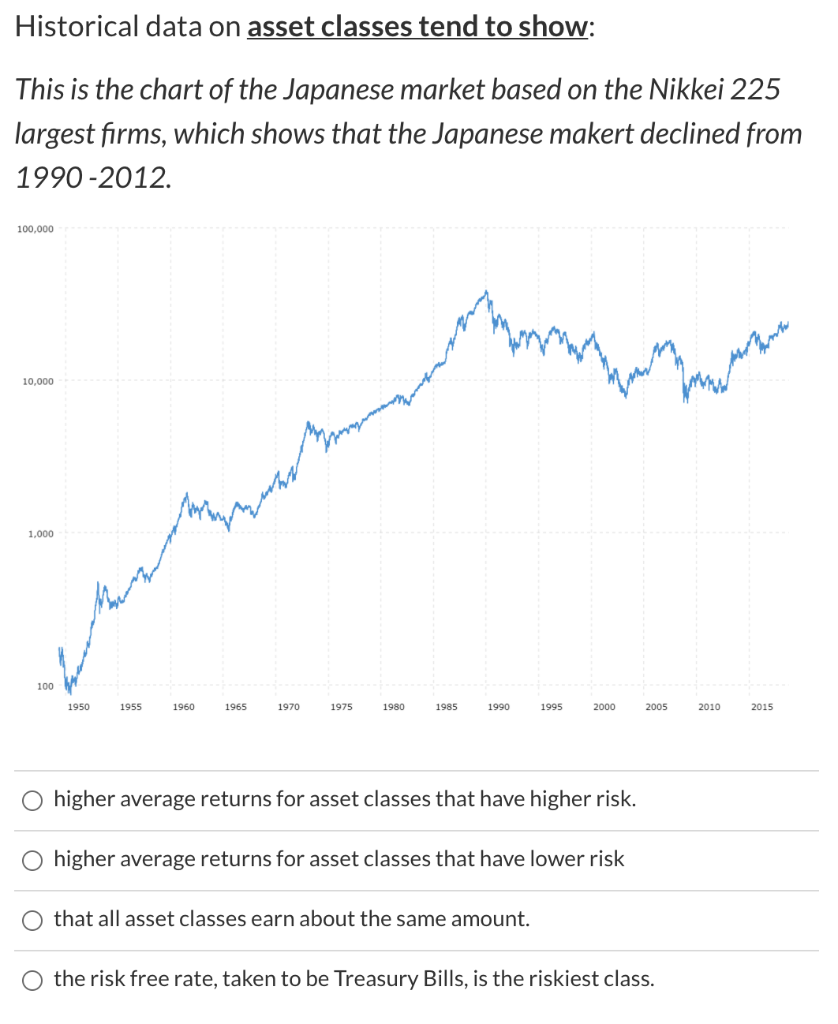
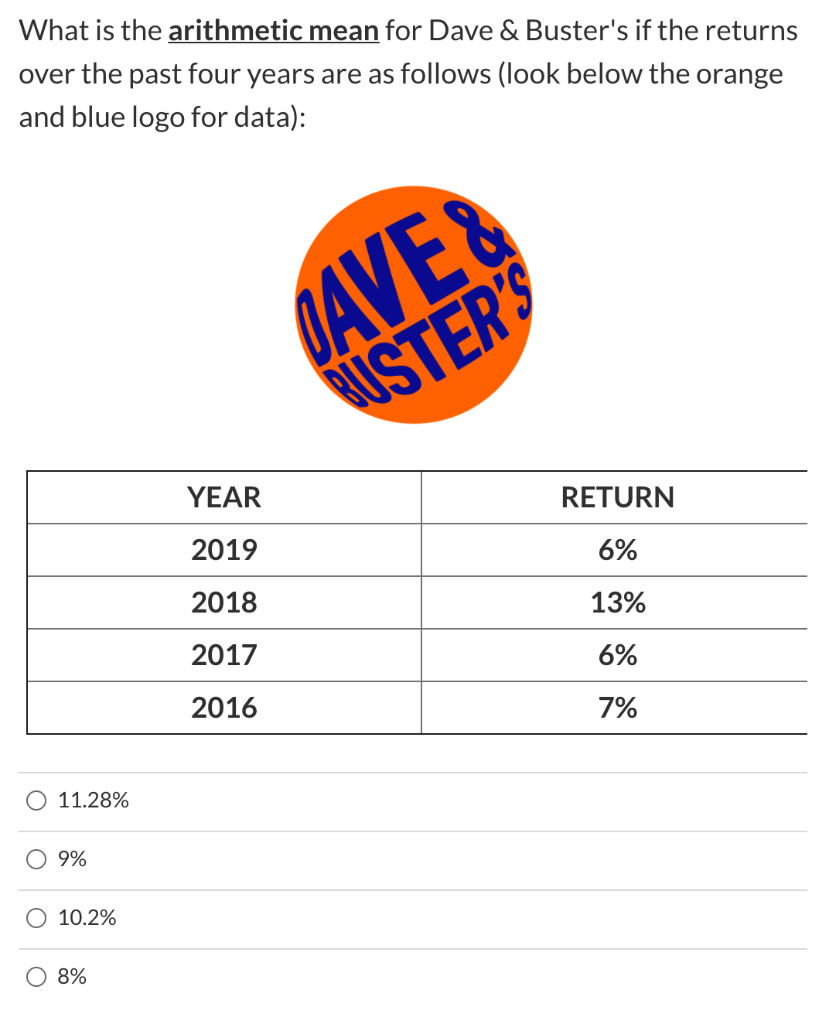
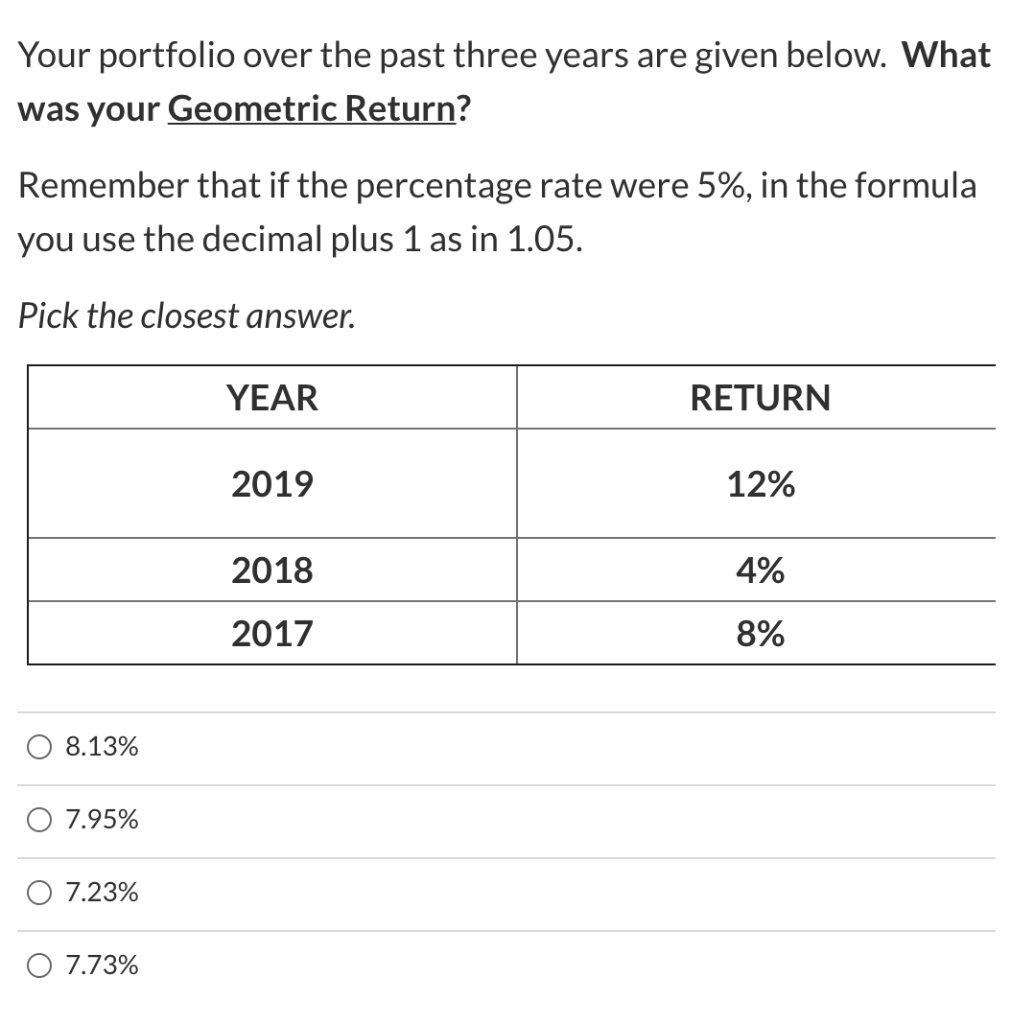
Historical data on asset classes tend to show: This is the chart of the Japanese market based on the Nikkei 225 largest firms, which shows that the Japanese makert declined from 1990-2012. 100,000 mann 10,000 mun 1,000 100 1950 1955 1960 1965 1970 1975 1980 1985 1990 1995 2000 2005 2010 2015 O higher average returns for asset classes that have higher risk. higher average returns for asset classes that have lower risk that all asset classes earn about the same amount. the risk free rate, taken to be Treasury Bills, is the riskiest class. What is the arithmetic mean for Dave & Buster's if the returns over the past four years are as follows (look below the orange and blue logo for data): DAVE 8 BUSTER'S YEAR RETURN 2019 6% 2018 13% 2017 6% 2016 7% 11.28% 9% 10.2% 8% Your portfolio over the past three years are given below. What was your Geometric Return? Remember that if the percentage rate were 5%, in the formula you use the decimal plus 1 as in 1.05. Pick the closest answer. YEAR RETURN 2019 12% 2018 4% 2017 8% 8.13% 7.95% O 7.23% O 7.73%
Step by Step Solution
There are 3 Steps involved in it

Get step-by-step solutions from verified subject matter experts