

Answered step by step
Verified Expert Solution
Question
1 Approved Answer
Hi-Tek Manufacturing, Incorporated, makes two types of industrial component parts-the B300 and the T500. An absorption costing income statement for the most recent period
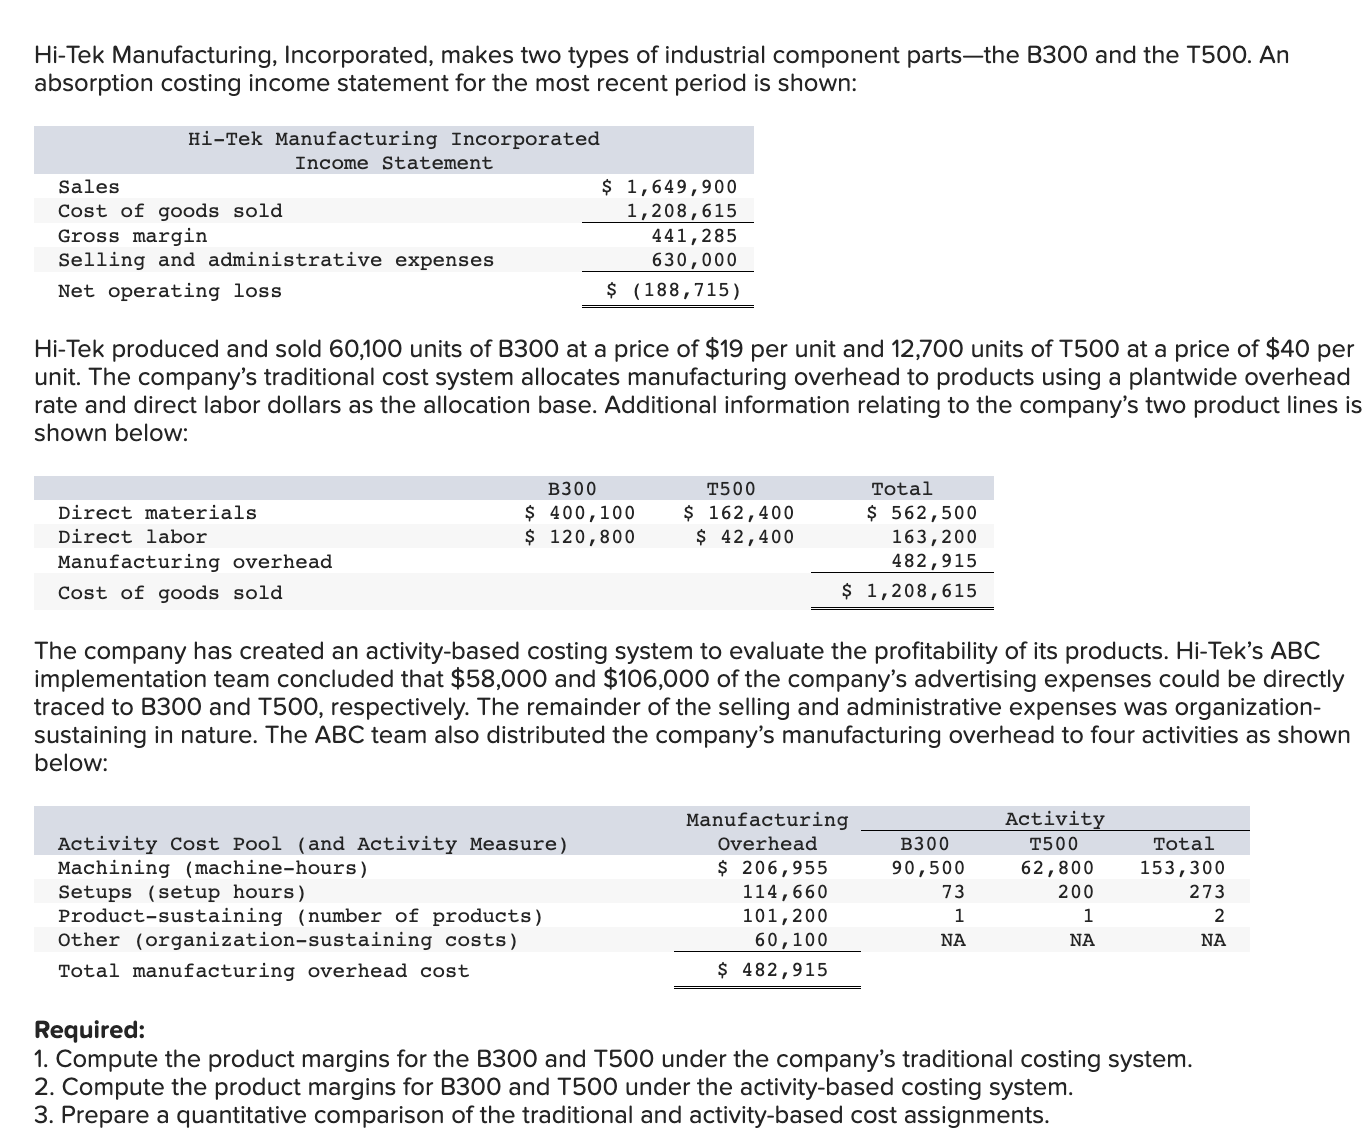
Hi-Tek Manufacturing, Incorporated, makes two types of industrial component parts-the B300 and the T500. An absorption costing income statement for the most recent period is shown: Sales Hi-Tek Manufacturing Incorporated Income Statement Cost of goods sold Gross margin Selling and administrative expenses Net operating loss $ 1,649,900 1,208,615 441,285 630,000 $ (188,715) Hi-Tek produced and sold 60,100 units of B300 at a price of $19 per unit and 12,700 units of T500 at a price of $40 per unit. The company's traditional cost system allocates manufacturing overhead to products using a plantwide overhead rate and direct labor dollars as the allocation base. Additional information relating to the company's two product lines is shown below: Direct materials Direct labor Manufacturing overhead Cost of goods sold B300 $ 400,100 $ 120,800 T500 $ 162,400 $ 42,400 Total $ 562,500 163,200 482,915 $ 1,208,615 The company has created an activity-based costing system to evaluate the profitability of its products. Hi-Tek's ABC implementation team concluded that $58,000 and $106,000 of the company's advertising expenses could be directly traced to B300 and T500, respectively. The remainder of the selling and administrative expenses was organization- sustaining in nature. The ABC team also distributed the company's manufacturing overhead to four activities as shown below: Activity Cost Pool (and Activity Measure) Machining (machine-hours) Setups (setup hours) Product-sustaining (number of products) Manufacturing Overhead $ 206,955 114,660 101,200 B300 90,500 Activity T500 62,800 Total 153,300 73 200 1 1 273 2 Other (organization-sustaining costs) 60,100 NA NA NA Total manufacturing overhead cost $ 482,915 Required: 1. Compute the product margins for the B300 and T500 under the company's traditional costing system. 2. Compute the product margins for B300 and T500 under the activity-based costing system. 3. Prepare a quantitative comparison of the traditional and activity-based cost assignments.
Step by Step Solution
There are 3 Steps involved in it
Step: 1
1 Product margins under traditional costing system B300 Sales 60100 units x 19 per unit 1143900 Cost ...
Get Instant Access to Expert-Tailored Solutions
See step-by-step solutions with expert insights and AI powered tools for academic success
Step: 2

Step: 3
Document Format ( 2 attachments)
663ded362062b_960989.pdf
180 KBs PDF File
663ded362062b_960989.docx
120 KBs Word File
Ace Your Homework with AI
Get the answers you need in no time with our AI-driven, step-by-step assistance
Get Started
Managerial Accounting for Managers
Authors: Eric Noreen, Peter Brewer, Ray Garrison
4th edition
1259578542, 978-1259578540