

Question: HO HA Mean difference Standard Error Test Statistic P-value Conclusion HO HA Mean difference Standard Error Test Statistic P-value Conclusion A car dealer is concerned


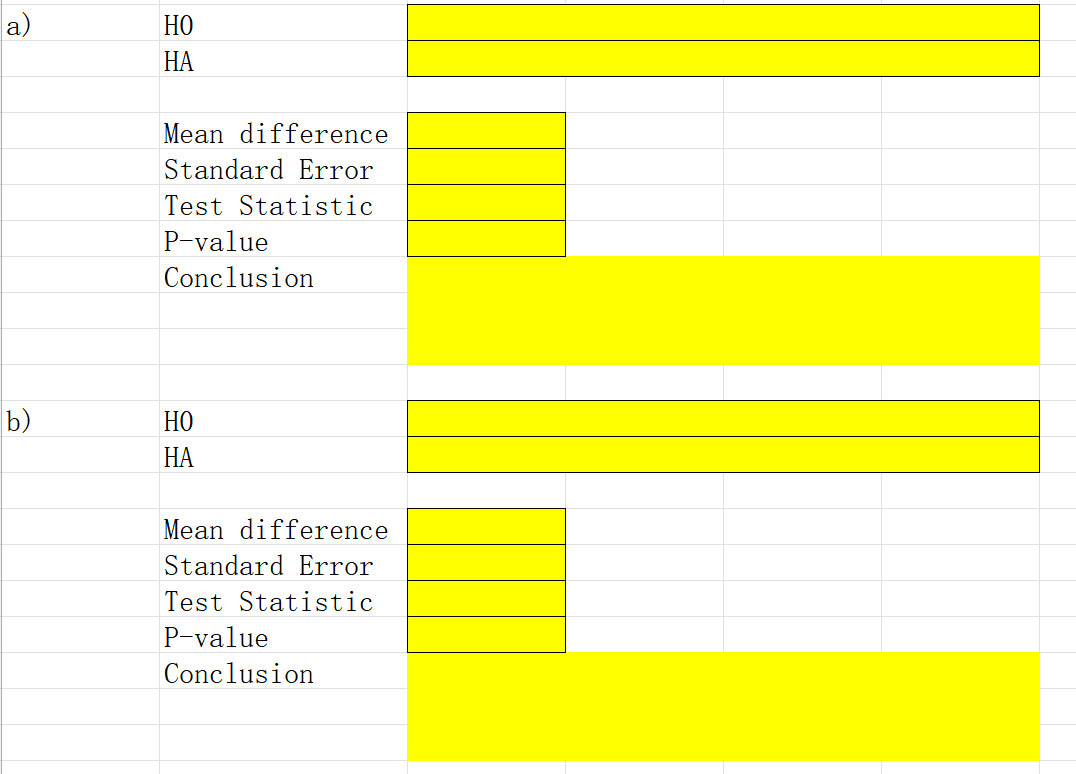
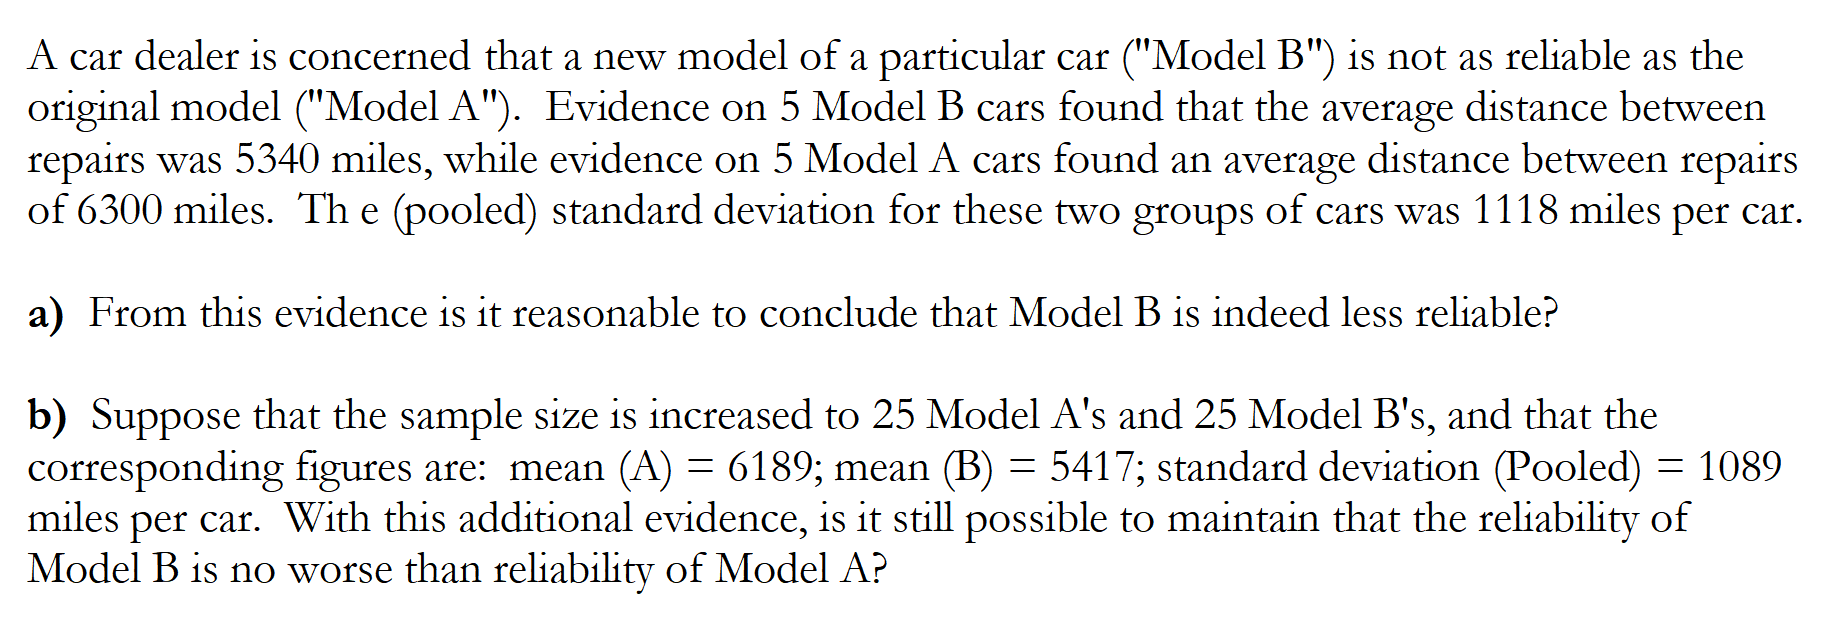
HO HA Mean difference Standard Error Test Statistic P-value Conclusion HO HA Mean difference Standard Error Test Statistic P-value Conclusion A car dealer is concerned that a new model of a particular car ("Model B") is not as reliable as the original model ("Model A"). Evidence on 5 Model B cars found that the average distance between repairs was 5340 miles, while evidence on 5 Model A cars found an average distance between repairs of 6300 miles. Th e (pooled) standard deviation for these two groups of cars was 1118 miles per car. a) From this evidence is it reasonable to conclude that Model B is indeed less reliable? b) Suppose that the sample size is increased to 25 Model A's and 25 Model B's, and that the corresponding figures are: mean (A) : 6189; mean (B) : 5417; standard deviation (Pooled) : 1089 miles per car. With this additional evidence, is it still possible to maintain that the reliability of Model B is no worse than reliability of Model A
Step by Step Solution
There are 3 Steps involved in it

Get step-by-step solutions from verified subject matter experts