

Question: Homework: Ch 7 Crunch the Numbers Exercise 1 Sa Score: 0 of 1 pt 1 of 1 (0 complete) HW Score: 0%, 0 of CTN
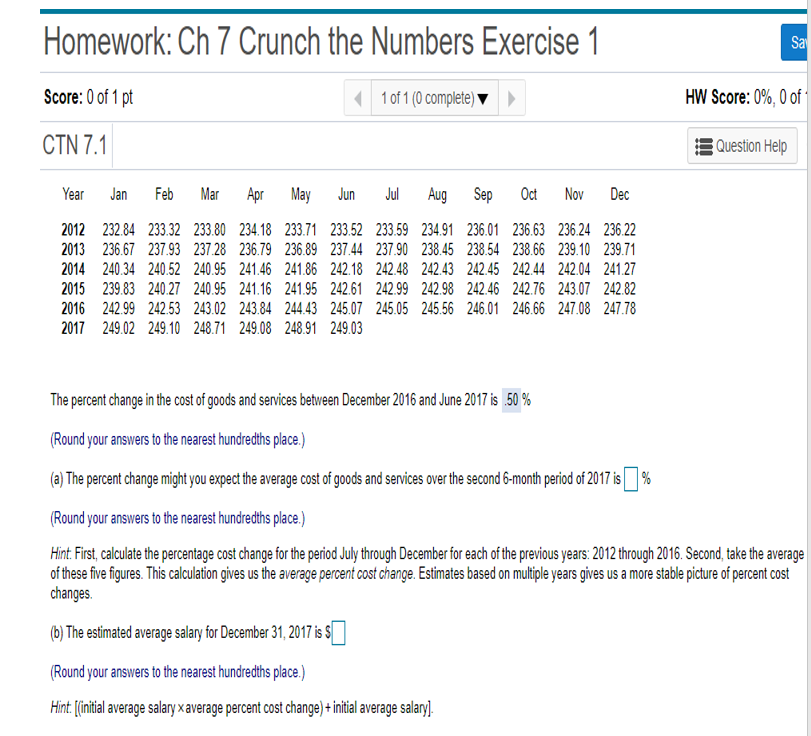
Homework: Ch 7 Crunch the Numbers Exercise 1 Sa Score: 0 of 1 pt 1 of 1 (0 complete) HW Score: 0%, 0 of CTN 7.1 Question Help Year Jan Feb Mar Apr May Jun Jul Aug Sep Oct Nov Dec 2012 232.84 233.32 233.80 234.18 233.71 233.52 233.59 234.91 236.01 236.63 236.24 236.22 2013 236.67 237.93 237.28 236.79 236.89 237.44 237.90 238.45 238.54 238.66 239.10 239.71 2014 240.34 240.52 240.95 241.46 241.86 242.18 242.48 242.43 242.45 242.44 242.04 241.27 2015 239.83 240.27 240.95 241.16 241.95 242.61 242.99 242.98 242.46 242.76 243.07 242.82 2016 242.99 242.53 243.02 243.84 244.43 245.07 245.05 245.56 246.01 246.66 247.08 247.78 2017 249.02 249.10 248.71 249.08 248.91 249.03 The percent change in the cost of goods and services between December 2016 and June 2017 is 50 % (Round your answers to the nearest hundredths place.) (a) The percent change might you expect the average cost of goods and services over the second 6-month period of 2017 is ] % (Round your answers to the nearest hundredths place.) Hint. First, calculate the percentage cost change for the period July through December for each of the previous years: 2012 through 2016. Second, take the average of these five figures. This calculation gives us the average percent cost change. Estimates based on multiple years gives us a more stable picture of percent cost changes (b) The estimated average salary for December 31, 2017 is $ (Round your answers to the nearest hundredths place.) Hint. [(initial average salary xaverage percent cost change) + initial average salary]
Step by Step Solution
There are 3 Steps involved in it

Get step-by-step solutions from verified subject matter experts