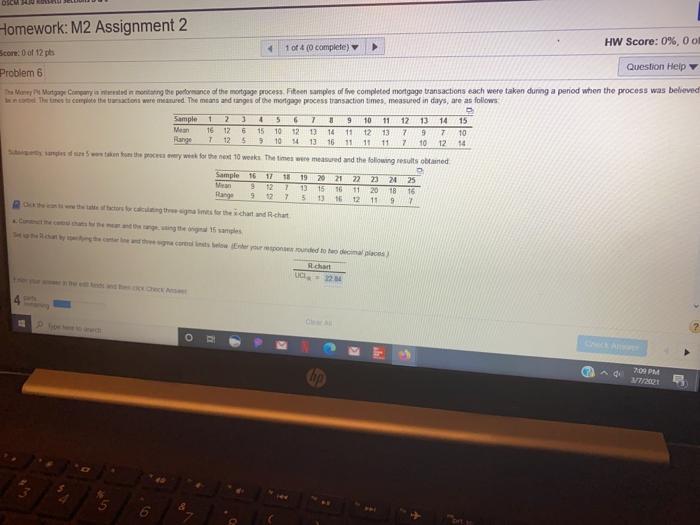
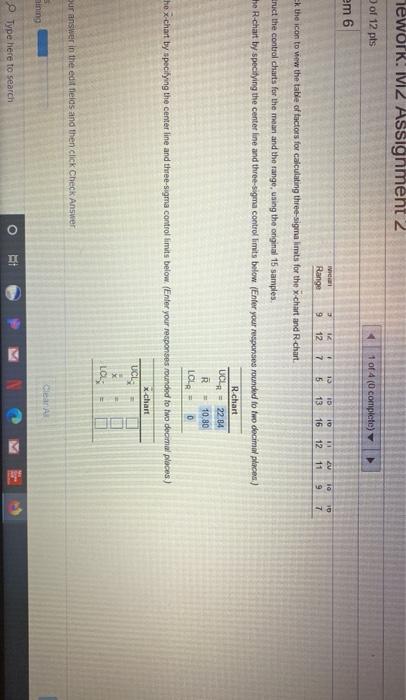
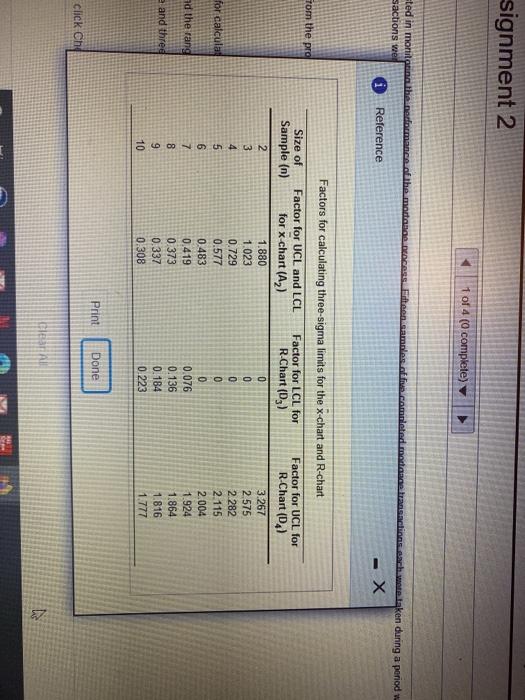
Question: Homework: M2 Assignment 2 HW Score: 0%, 0 o Score of 12 pts 1 of 4 (0 complete) Question Help Problem 6 WP Mortgage Caymonising

Homework: M2 Assignment 2 HW Score: 0%, 0 o Score
Homework: M2 Assignment 2 HW Score: 0%, 0 o Score of 12 pts 1 of 4 (0 complete) Question Help Problem 6 WP Mortgage Caymonising the performance of the mortgage process. Fiton samples offre completed mortgage transactions each were taken during a period when the process was believed The timestamp the tractions were med The means and anges of the mortgage process transaction times, measured in days are as follows Sample 1 2 6 7 9 10 11 12 13 14 15 Mean 16 126 10 11 12 7 9 7 10 Range 1 12 'S 5 10 16 11 10 12 14 Stone the procesy week for the next 10 wenke the times we measured and the following results obtained Sample 16 2020 23 24 25 9 13 15 16 20 Range 18 12 1.7 1316 11 97 3 5 4 15 12 14 13 11 11 7 18 19 22 11 12 16 9 chart = 24 4 7:00 PM TIMES TewOrR: M2 Assignment 2 of 12 pts A 1 of 4 (0 complete) em 6 IMG Range 9 12 13 5 ID 13 7 10 16 1 20 12 11 10 9 10 7 k the icon to view the table of factors for calculating three-sigma limits for the x-chart and R chart ruct the control charts for the mean and the range, using the original 15 samples the R.chart by specifying the center line and three-sigma control limits below (Enter your responses rounded to two decimal phacea) R.chart UCLR = 22.84 R 10.80 LCLR = D hex chart by specifying the center line and three-sigma control limits below (Enter your responses rounded to two dromul places) x-chart UCL LOL our answer in the edit fields and then click Check Answer Clean nining E Type here to search signment 2 1 of 4 (0 complete) sted in monitoring the performance of the most accession camoles of fun.com leted modne transactions each matelaken during a period sactions wed Reference - X Factors for calculating three-sigma limits for the x-chart and R-chart From the prol Size of Sample (n) Factor for LCL for R-Chart (D3) 2 3 4 5 6 7 8 9 10 for calculad Factor for UCL and LCL for x-chart (A2) 1.880 1.023 0.729 0.577 0.483 0.419 0.373 0.337 0:308 OOOOO Factor for UCL for R-Chart (D) 3.267 2.575 2.282 2.115 2.004 1.924 1.864 1816 1.777 ad the rang e and three 0.076 0.136 0.184 0.223 Print Done Click Chd DESTA 72

Step by Step Solution

There are 3 Steps involved in it

1 Expert Approved Answer
Step: 1 Unlock blur-text-image
Question Has Been Solved by an Expert!

Get step-by-step solutions from verified subject matter experts

Step: 2 Unlock
Step: 3 Unlock

Students Have Also Explored These Related General Management Questions!