

Question: How are r_0 and E_0 on the plot calculated? What equations and values are used to calculate them? 2.15 For a K-Ct ion pair, attractive
How are r_0 and E_0 on the plot calculated? What equations and values are used to calculate them?
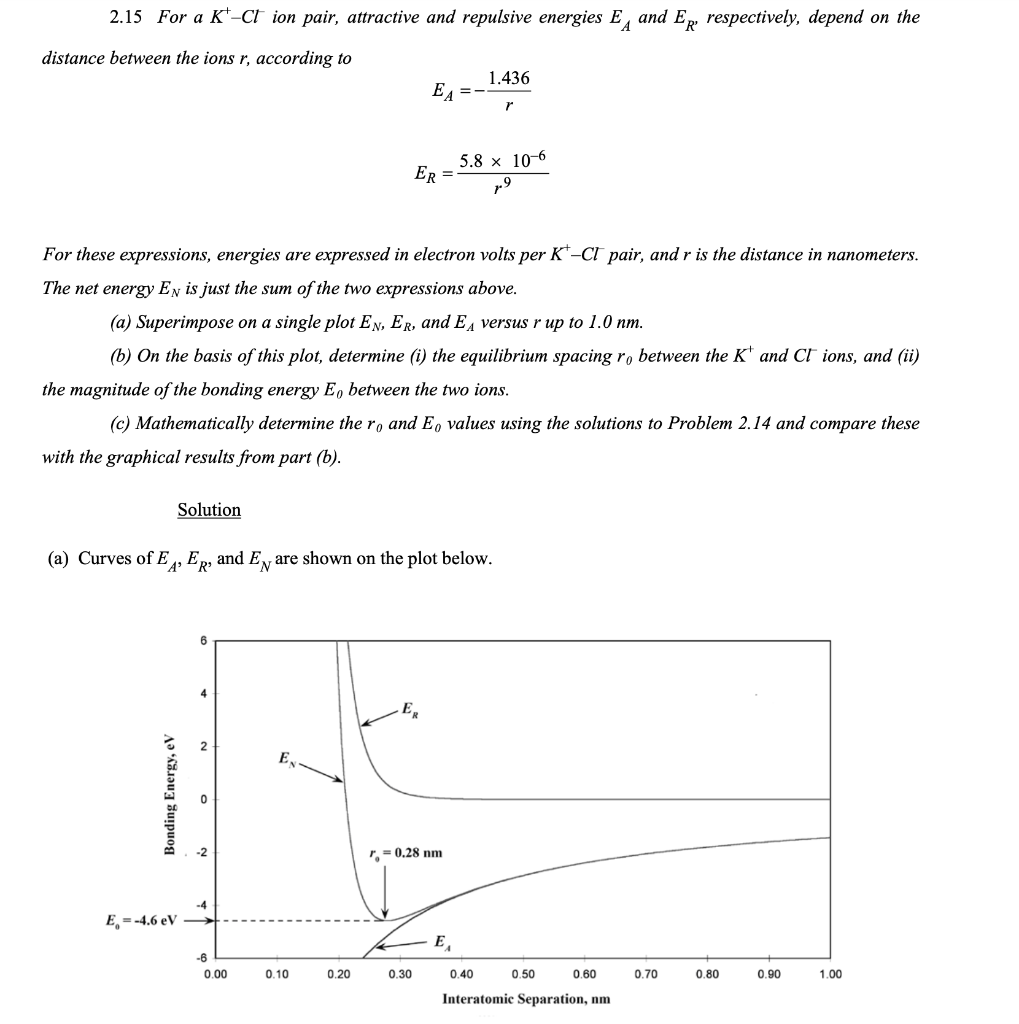
2.15 For a K-Ct ion pair, attractive and repulsive energies EA and Ep, respectively, depend on the distance between the ions r, according to 1.436 EA =- r 5.8 x 10⁻⁶ ER= r9 For these expressions, energies are expressed in electron volts per K-CT pair, and r is the distance in nanometers. The net energy Ey is just the sum of the two expressions above. (a) Superimpose on a single plot En, Er, and E, versus r up to 1.0 nm. (6) On the basis of this plot, determine (i) the equilibrium spacing ro between the K and CT ions, and (ii) the magnitude of the bonding energy E, between the two ions. (c) Mathematically determine the r, and E, values using the solutions to Problem 2.14 and compare these with the graphical results from part (b). Solution (a) Curves of EA, ER, and Ey are shown on the plot below. 6 4 ER E Bonding Energy, eV r. -0.28 nm E--4.6 eV E -6 0.00 0.10 0.20 0.30 0.40 0.50 0.60 0.70 0.80 0.90 1.00 Interatomic Separation, nm
Step by Step Solution
There are 3 Steps involved in it

Get step-by-step solutions from verified subject matter experts