

Question: How are the horizontal and vertical axis represented in Boston Consulting Group ( BCG ) Matrix? horizontal axis representing relative market share and the vertical
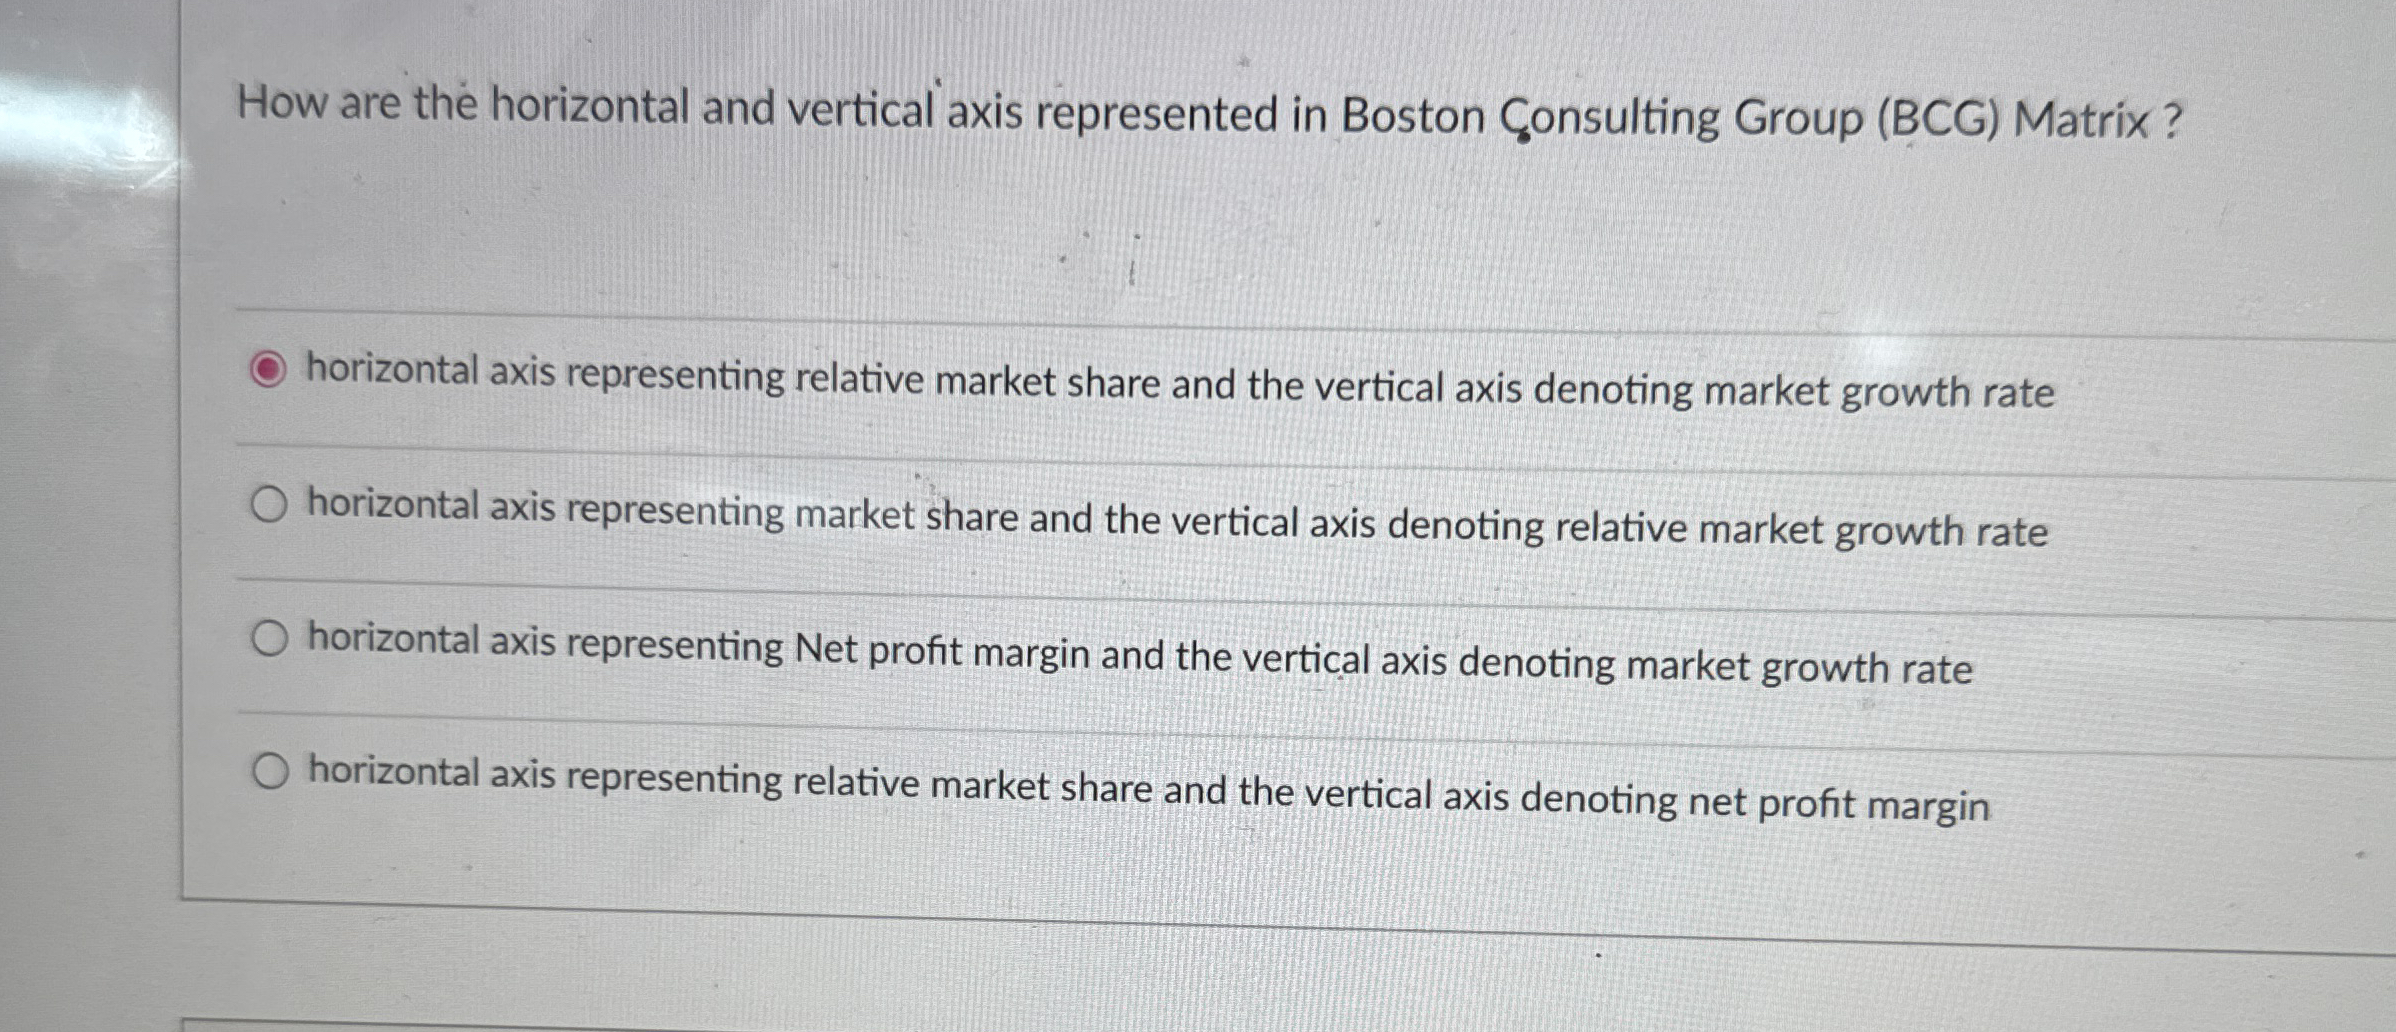
How are the horizontal and vertical axis represented in Boston Consulting Group BCG Matrix?
horizontal axis representing relative market share and the vertical axis denoting market growth rate
horizontal axis representing market share and the vertical axis denoting relative market growth rate
horizontal axis representing Net profit margin and the vertical axis denoting market growth rate
horizontal axis representing relative market share and the vertical axis denoting net profit margin
Step by Step Solution
There are 3 Steps involved in it
1 Expert Approved Answer
Step: 1 Unlock

Question Has Been Solved by an Expert!
Get step-by-step solutions from verified subject matter experts
Step: 2 Unlock
Step: 3 Unlock