

Question: How can I explain the following Boxplot? outliers #1 self-esteem 4-14, outliers #2 sex toys 4-18-15. Boxplots Self-esteem 4.0 4. 14 3.5 3.0 Self-esteem 2.5
How can I explain the following Boxplot? outliers #1 self-esteem 4-14, outliers #2 sex toys 4-18-15.
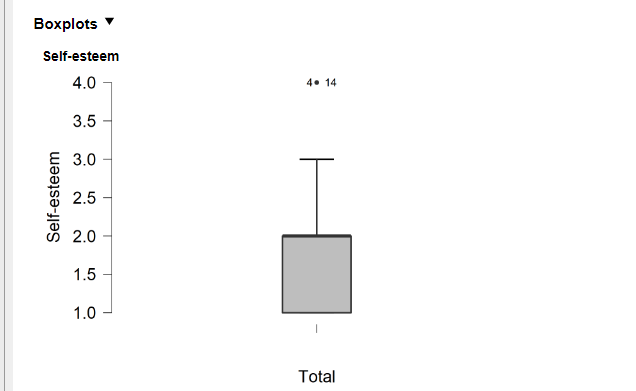
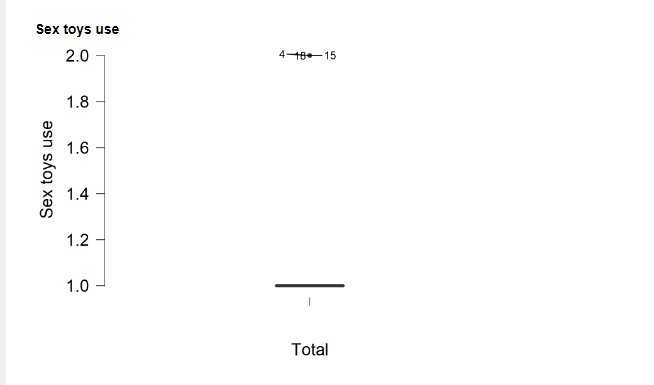
Boxplots Self-esteem 4.0 4. 14 3.5 3.0 Self-esteem 2.5 2.0 1.5 1.0 TotalSex toys use 2.0 4-10#15 1.8 1.6 Sex toys use 1.4 1.2 1.0 Total
Step by Step Solution
There are 3 Steps involved in it
1 Expert Approved Answer
Step: 1 Unlock

Question Has Been Solved by an Expert!
Get step-by-step solutions from verified subject matter experts
Step: 2 Unlock
Step: 3 Unlock