

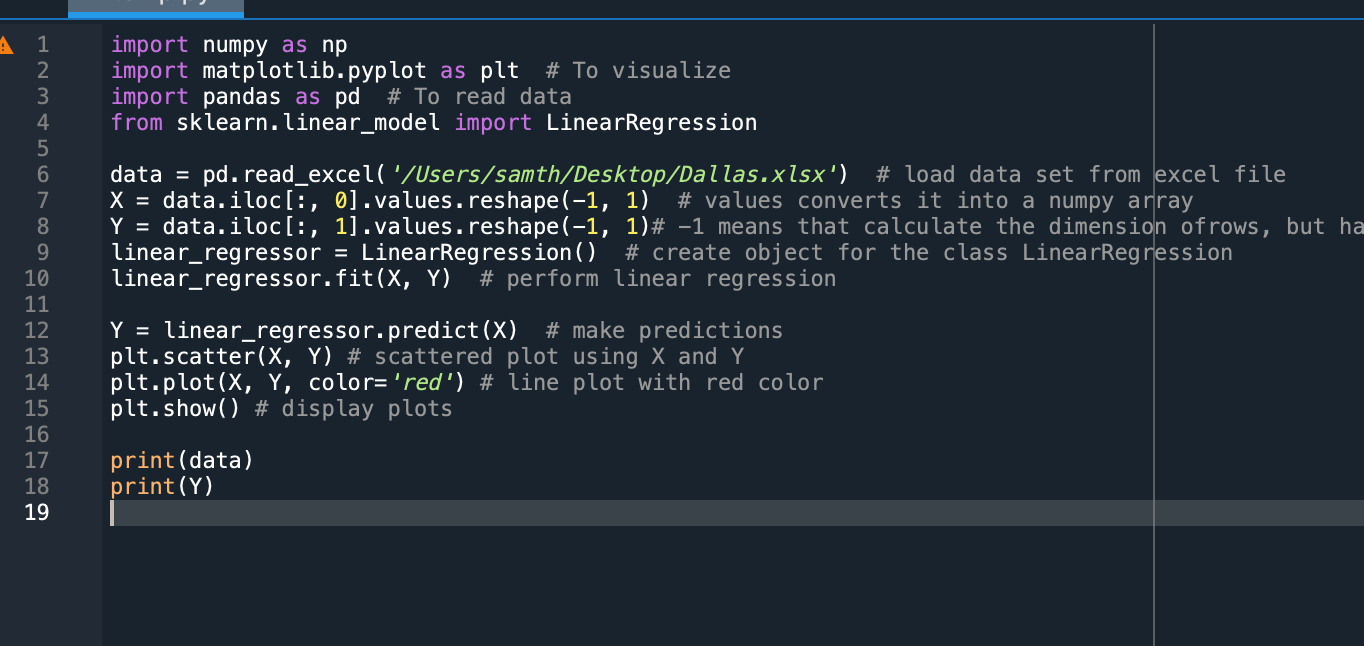
Question: How can it print the graph from this code? thanks and show the out put as well please! In [2]: runfile( '/Users/samth/.spyder-py3/temp.py', wdir='/Users/samth/.spyder-py 3 ')
![the out put as well please! In [2]: runfile( '/Users/samth/.spyder-py3/temp.py', wdir='/Users/samth/.spyder-py 3](https://s3.amazonaws.com/si.experts.images/answers/2024/09/66dd24c2cdbe0_89866dd24c252436.jpg) How can it print the graph from this code? thanks and show the out put as well please!
How can it print the graph from this code? thanks and show the out put as well please!
In [2]: runfile( '/Users/samth/.spyder-py3/temp.py', wdir='/Users/samth/.spyder-py 3 ') TMAX TMIN 061.042.6 1261.173.141.356.0 23456789101173.176.384.592.795.298.285.077.072.661.756.055.465.874.078.877.367.556.551.138.3 [ [40.54024824] [40.64592509] [53.32714725] [56.70880649] [65.3743083] [74.03981011] [76.68173139] [79.85203693] [57.44854445] [57.44854445] [41.2799862] ] In [2]: runfile( '/Users/samth/.spyder-py3/temp.py', wdir='/Users/samth/.spyder-py 3 ') TMAX TMIN 061.042.6 1261.173.141.356.0 23456789101173.176.384.592.795.298.285.077.072.661.756.055.465.874.078.877.367.556.551.138.3 [ [40.54024824] [40.64592509] [53.32714725] [56.70880649] [65.3743083] [74.03981011] [76.68173139] [79.85203693] [57.44854445] [57.44854445] [41.2799862] ]
Step by Step Solution
There are 3 Steps involved in it

Get step-by-step solutions from verified subject matter experts