

Question: How could you use a DCF-based estimate for the practice value? Based on case Exhibit 3, what is the free cash flow (FCF) expected each
- How could you use a DCF-based estimate for the practice value?
- Based on case Exhibit 3, what is the free cash flow (FCF) expected each year?
- How would you estimate a terminal value (TV) for the practice in 2023?
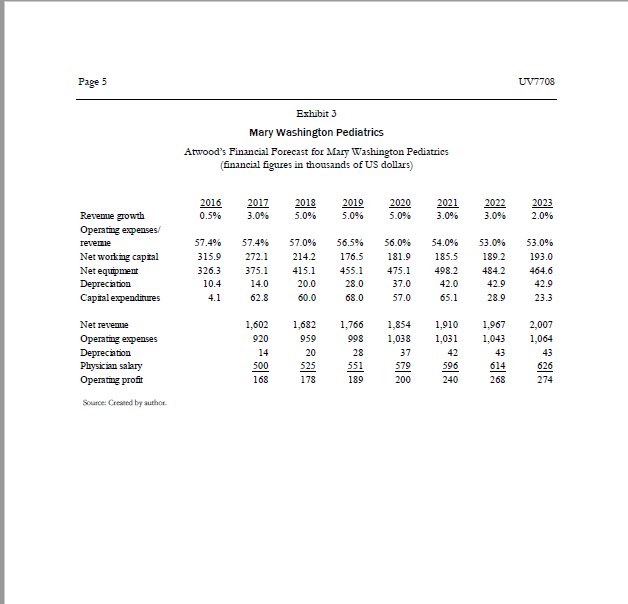
Page 5 UV7708 Exhibit 3 Mary Washington Pediatrics Atwood's Financial Forecast for Mary Washington Pediatrics (financial figures in thousands of US dollars) 2016 0.5% 2017 3.0% 2018 5.0% 2019 5.0% 2020 5.0% 2021 3.0% 2022 3.0% 2023 2.0% Reveme growth Operating expenses/ reveme Net working captal Net equipment Depreciation Capital expenditures 57.4% 315.9 326.3 10.4 4.1 57.4% 272.1 375.1 14.0 62.8 57.0% 214.2 415.1 20.0 60.0 56.5% 176.5 455.1 28.0 68.0 56.0% 181.9 475.1 37.0 57.0 54.0% 185.5 498.2 42.0 65.1 53.0% 1892 4842 42.9 28.9 53.0% 193.0 464.6 42.9 23.3 1,602 1,766 1,682 959 1,910 1,031 920 998 Net revenue Operating expenses Depreciation Physician salary Operating profit 1,854 1,038 37 579 200 1.967 1,043 43 2,007 1,064 43 28 500 596 525 178 1939 240 Source: Created by author The Atwood-Juarez Plan Atwood and Juarez had not been raised in homes with medical backgrounds. Juarez was raised by parents who were both New York investment bankers. Atwood's father had worked in the consulting industry. As such, neither of them was new to business turnaround stories. Their motivation in working together was based on their friendship and their mutual interest in applying their business upbringing to a poorly run medical practice. Juarez and Atwood agreed that pediatric practices were rife with financial waste and mismanagement. They believed that Mary Washington Pediatric fit that profile and provided substantial opportunities for improved efficiency and growth. As evidence of the practice's underperformance, the pair compared its financial performance to that of Atwood and Juarez's current employers, Green Hills Pediatrics and Harpeth Group (see Exhibit 2). Atwood had prepared a financial forecast for Mary Washington Pediatrics based on their expectations for financial improvement (see Exhibit 3). The plan included the following assumptions: (1) revenue would grow above expected inflation for the next seven years with a peak of 5%; (2) operating margins would be improved with careful attention to wasteful and unnecessary expenditures, and (3) investment in current assets could be reduced dramatically with better cash, upgraded inventory supplies management, and improved bill collection, such that the investment in working capital would decline from a networking capital turnover of 5 to over 10 times by 2019. Atwood recognized that the equipment used in the practice was wildly out of date. She had included large investments for office equipment in the projection. Lastly, her assumption for physician salary was that it would grow with net revenue. It was now Juarez's turn to put a value on the forecast. She had spent some time earlier working through a cost of capital estimate. A 9% rate resonated with her, and was confirmed with an email from her parents. An additional concern was financing the deal She and Atwood each had $250,000 in savings that they could combine for the purchase. The rest of the deal however, they expected to finance with debt. With all that she knew from growing up in her parents' household Juarez believed she had the wherewithal to put the financing together and expected that she could get a seven-year note at a 5% interest rate to find the deal. Networking capital was defined as current assets less current labaite. Net wocking capital turnover was defined as net revenue divided by net working capital Page 5 UV7708 Exhibit 3 Mary Washington Pediatrics Atwood's Financial Forecast for Mary Washington Pediatrics (financial figures in thousands of US dollars) 2016 0.5% 2017 3.0% 2018 5.0% 2019 5.0% 2020 5.0% 2021 3.0% 2022 3.0% 2023 2.0% Reveme growth Operating expenses/ reveme Net working captal Net equipment Depreciation Capital expenditures 57.4% 315.9 326.3 10.4 4.1 57.4% 272.1 375.1 14.0 62.8 57.0% 214.2 415.1 20.0 60.0 56.5% 176.5 455.1 28.0 68.0 56.0% 181.9 475.1 37.0 57.0 54.0% 185.5 498.2 42.0 65.1 53.0% 1892 4842 42.9 28.9 53.0% 193.0 464.6 42.9 23.3 1,602 1,766 1,682 959 1,910 1,031 920 998 Net revenue Operating expenses Depreciation Physician salary Operating profit 1,854 1,038 37 579 200 1.967 1,043 43 2,007 1,064 43 28 500 596 525 178 1939 240 Source: Created by author The Atwood-Juarez Plan Atwood and Juarez had not been raised in homes with medical backgrounds. Juarez was raised by parents who were both New York investment bankers. Atwood's father had worked in the consulting industry. As such, neither of them was new to business turnaround stories. Their motivation in working together was based on their friendship and their mutual interest in applying their business upbringing to a poorly run medical practice. Juarez and Atwood agreed that pediatric practices were rife with financial waste and mismanagement. They believed that Mary Washington Pediatric fit that profile and provided substantial opportunities for improved efficiency and growth. As evidence of the practice's underperformance, the pair compared its financial performance to that of Atwood and Juarez's current employers, Green Hills Pediatrics and Harpeth Group (see Exhibit 2). Atwood had prepared a financial forecast for Mary Washington Pediatrics based on their expectations for financial improvement (see Exhibit 3). The plan included the following assumptions: (1) revenue would grow above expected inflation for the next seven years with a peak of 5%; (2) operating margins would be improved with careful attention to wasteful and unnecessary expenditures, and (3) investment in current assets could be reduced dramatically with better cash, upgraded inventory supplies management, and improved bill collection, such that the investment in working capital would decline from a networking capital turnover of 5 to over 10 times by 2019. Atwood recognized that the equipment used in the practice was wildly out of date. She had included large investments for office equipment in the projection. Lastly, her assumption for physician salary was that it would grow with net revenue. It was now Juarez's turn to put a value on the forecast. She had spent some time earlier working through a cost of capital estimate. A 9% rate resonated with her, and was confirmed with an email from her parents. An additional concern was financing the deal She and Atwood each had $250,000 in savings that they could combine for the purchase. The rest of the deal however, they expected to finance with debt. With all that she knew from growing up in her parents' household Juarez believed she had the wherewithal to put the financing together and expected that she could get a seven-year note at a 5% interest rate to find the deal. Networking capital was defined as current assets less current labaite. Net wocking capital turnover was defined as net revenue divided by net working capital
Step by Step Solution
There are 3 Steps involved in it

Get step-by-step solutions from verified subject matter experts